Windows Registry Forensics
October 22, 2025 • Digital Forensic

A walkthrough of Windows registry forensic analysis from evidence acquisition to detailed artifact examination, following proper forensic procedures.
Windows Registry Forensic Analysis
As part of our comprehensive Digital Forensic Investigation of a compromised machine from initial detection to full incident analysis and conclusion this write-up serves as a continuation of our previous investigations. The earlier stages of this series include:
- Monitoring, Investigation, and Escalation as SOC L1
- Forensic Memory and Disk Acquisition on Windows VirtualBox
- Network Packet Analysis
Evidence Acquisition Phase
Using Arsenal Image Mounter for Disk Mounting
So first we begin by using Arsenal Image Mounter - it's a tool that we can use to mount our extracted hard disk. So we first open the Arsenal Image Mounter and it will give us a prompt like this:
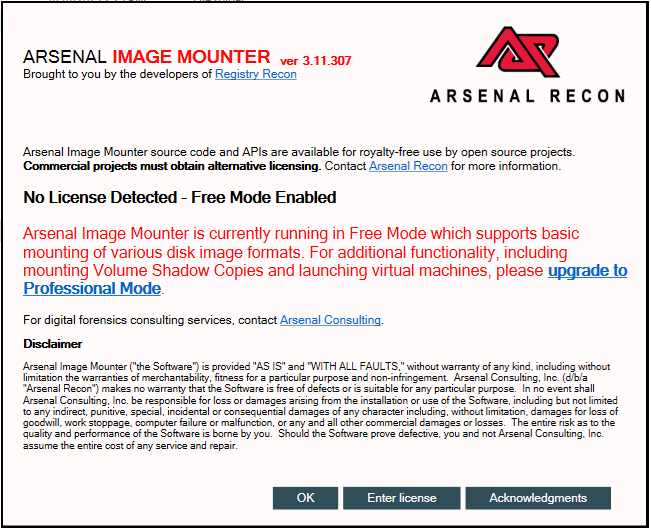
As for this demo, the free version is enough - we just click okay and move ahead. Now it will give us the below interface:
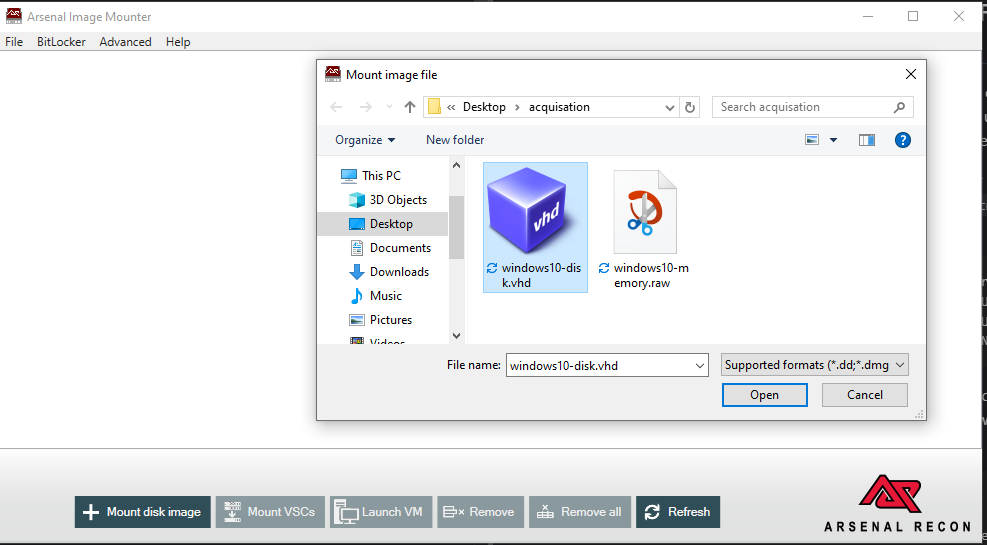
We just have to click on mount and navigate to the path where we store our hard disk file. Arsenal Image Mounter is crucial in digital forensics because it allows us to mount disk images without modifying the original evidence. This maintains the integrity of our evidence, which is fundamental in forensic investigations. The tool creates a virtual disk that we can examine without altering the original image, ensuring our analysis is admissible in legal proceedings.
Now the important detail we have to pay attention to:
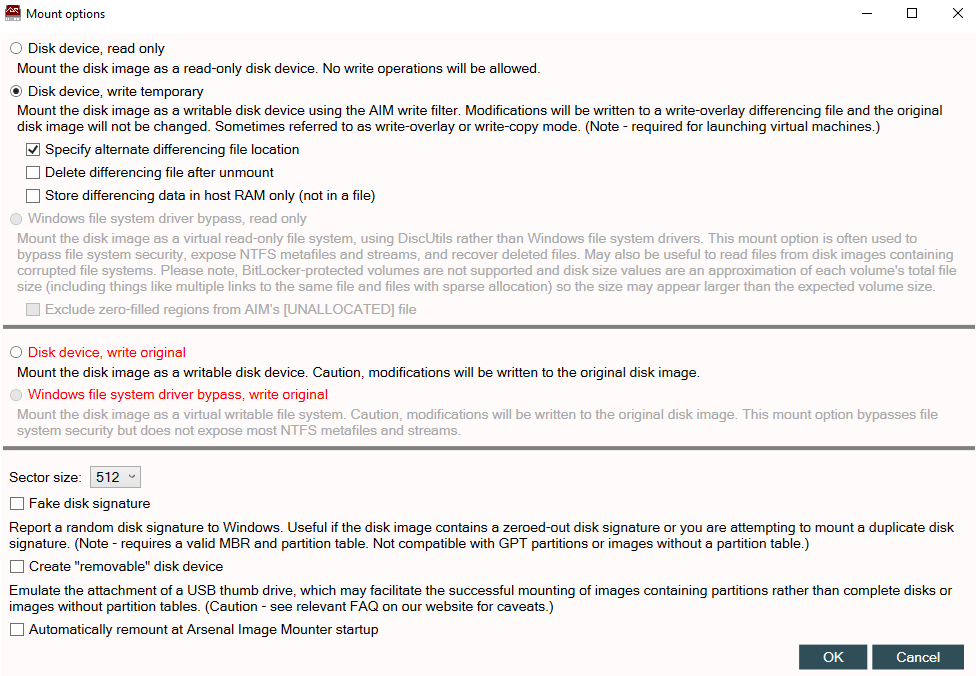
As now it's asking us some options:
- Disk device read only
- Disk device write only temporary
Normally during forensic, no write access should be enabled as it will overwrite our data, and for this image we need to perform some activities, so read only is not sufficient option.
Note: The "read only" option is the standard for forensic analysis because it prevents any accidental modifications to the evidence. The "write only temporary" option creates a differential file that records changes without altering the original image. This is important because in some cases we might need to test hypotheses or run tools that require write access, but we must always preserve the original evidence in its unaltered state.
So by default if we do dir we can see some contents of the file, but in our hives some files are hidden. So if we read the note given below under the write only option: "The effect of the write temporary mount option is described within the AIM mount options window."
Then finally it will mount our image:
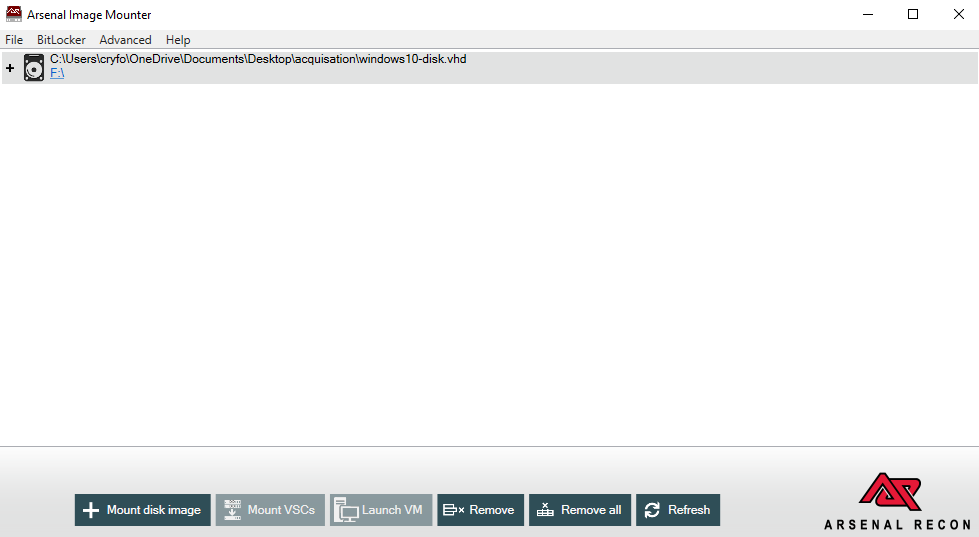
If we look at our file explorer we can see the disk image is mounted:
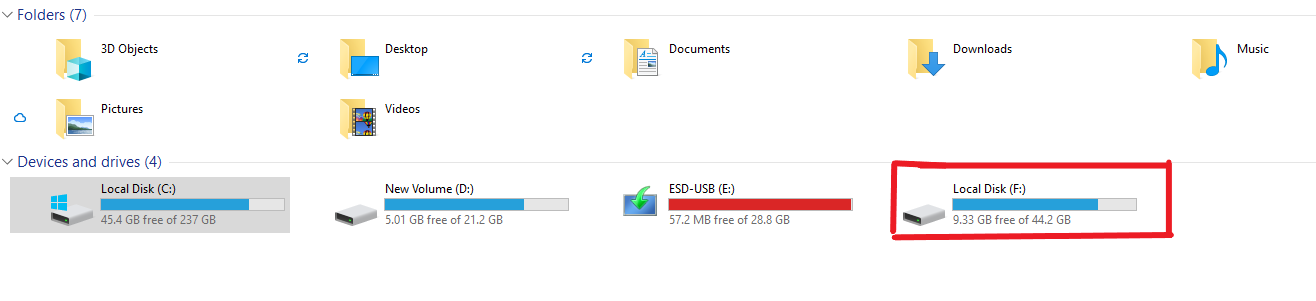
As we can see it's indicated by partition F.
When a disk image is mounted, it appears as a physical drive to the operating system. This allows forensic tools to interact with the image as if it were a real disk, enabling us to run various analysis tools without needing the original hardware. The drive letter assignment (F: in this case) is arbitrary and doesn't affect the forensic integrity of the analysis.
Triage Collection Process
So the next step is triage collection. We can either use FTK Imager or automate it - I mean speed the triage collection with KAPE.
In this demo we will go with KAPE as it makes triage collection easier and also, it's important - if we want to collect triage remotely, we just have to use the command line option and execute the command on a remote system.
Triage collection is the process of quickly gathering the most relevant forensic artifacts from a system. KAPE (Kroll Artifact Parser and Extractor) is specifically designed for digital forensics and incident response. It uses "targets" (what to collect) and "modules" (how to parse what was collected) to efficiently gather evidence. This is crucial in incident response where time is critical, and we need to quickly determine if a system is compromised.
So... using KAPE, we open KAPE and on the left-hand side check the target options button and select the source which should be our mounted disk and the destination should be where we would like to store the KapeTriage output.
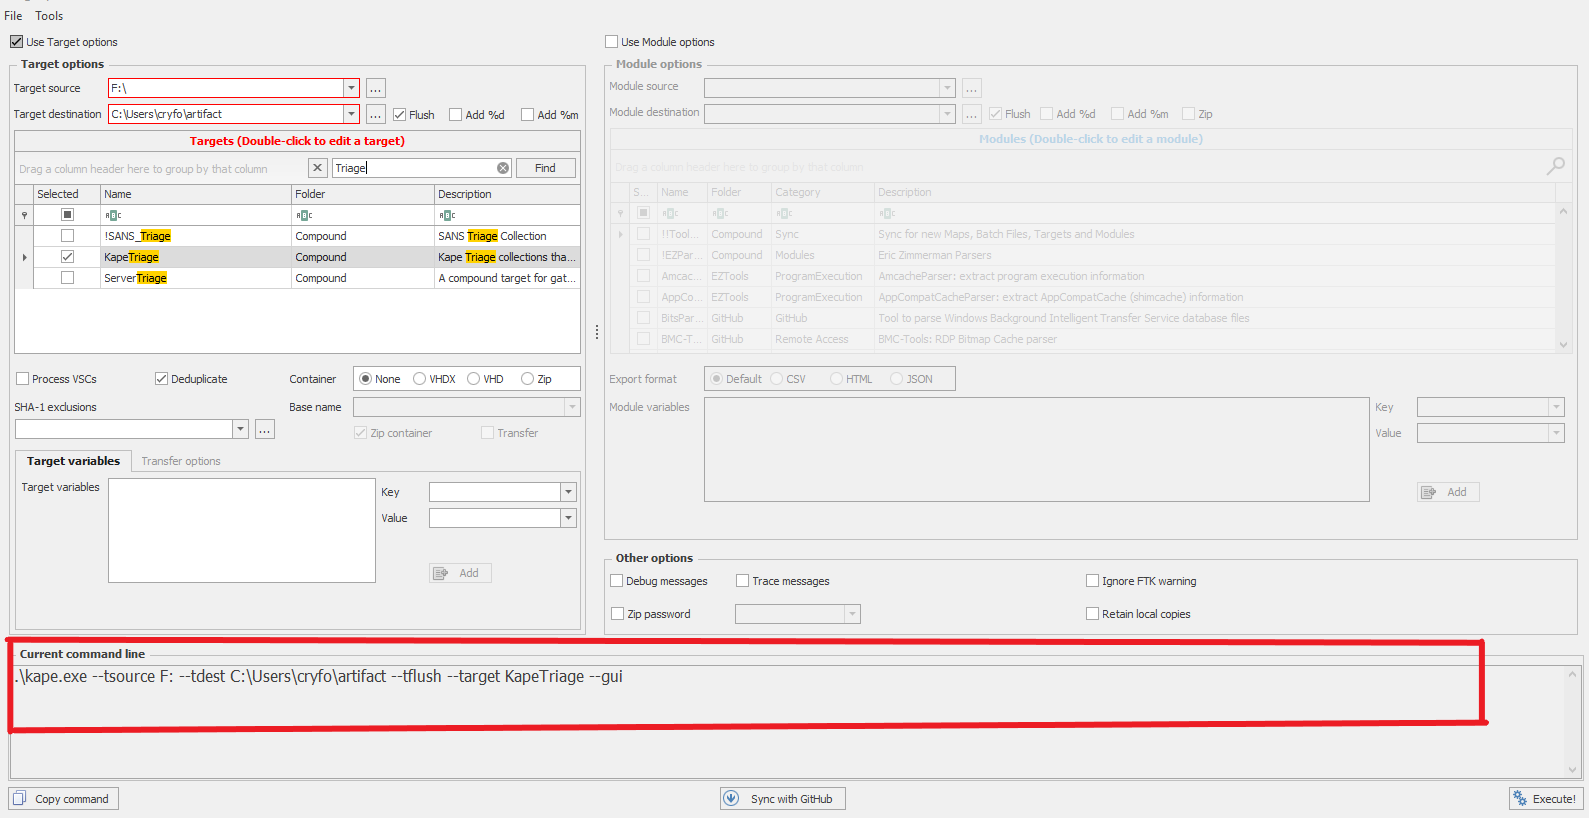
From the search bar, we can search for the specific data we would like to collect, but in our case, we are going for KapeTriage full collection. Below there is a command line generated - we can copy that and paste it in a command prompt which we will use for collecting the data.
From the right-hand side there is an option called use module option - in case we would like to parse it and pipe it to other tools we can do that and get the output, but in this case we don't need that. We just have to click execute or copy paste the command in the cmd. We will get this:
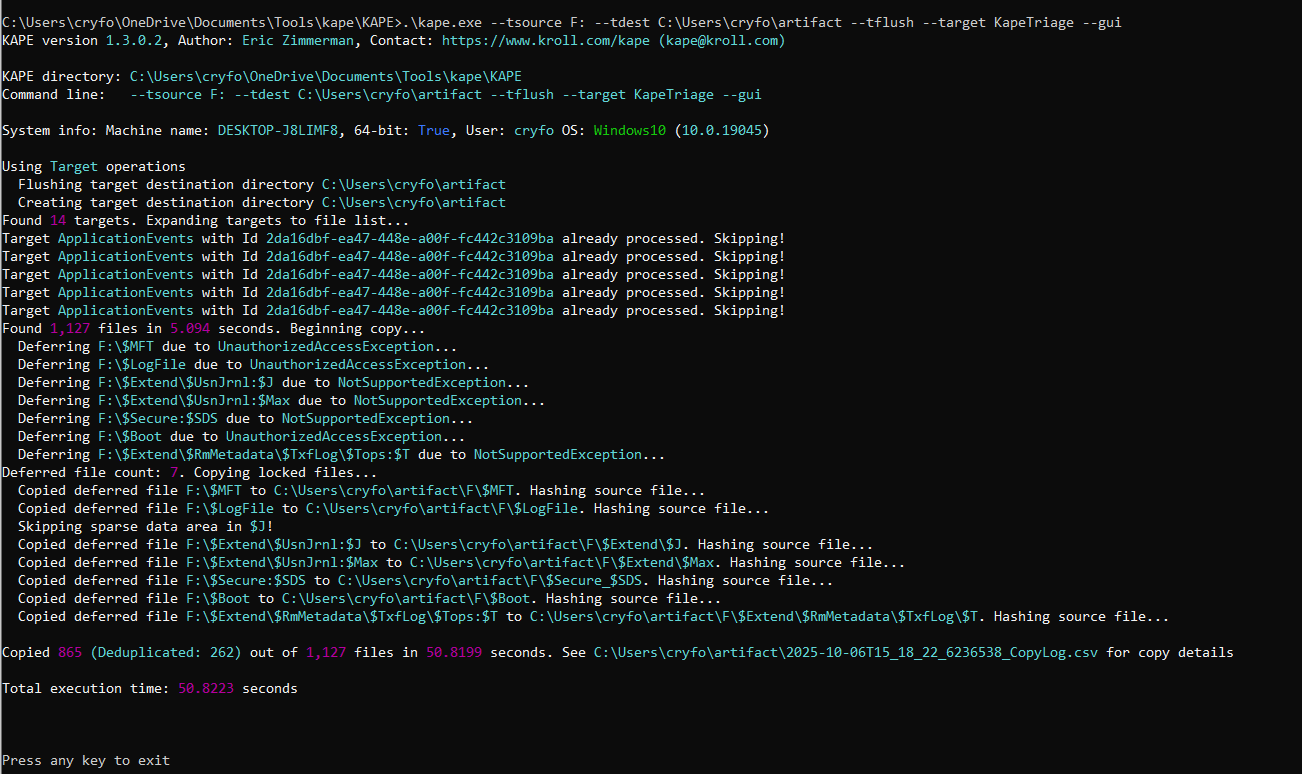
Then wait - we wait for it to finish. After that we will see the output in the destination folder we have selected from our kape which will look like this:
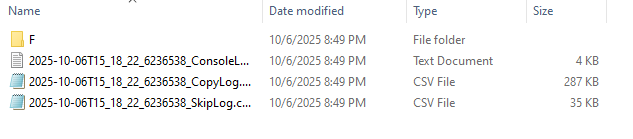
KAPE's command-line interface is particularly valuable because it creates an auditable trail of exactly what commands were executed. This is essential for maintaining chain of custody documentation. The tool also hashes all collected files, providing cryptographic verification that the evidence hasn't been altered during collection. The KapeTriage target collects over 100 different artifact types including registry hives, event logs, prefetch files, and browser artifacts.
Registry Hive Collection and Preparation
After that we just have to begin our analysis. We will begin with the hives, but before then, let's gather our hives in one folder to make it easy for us.
We can find the system hives at C:\Users\cryfo\artifact\F\Windows\System32\config
powershellpowershellPS C:\Users\cryfo\artifact\F\Windows\System32\config> ls
Directory: C:\Users\cryfo\artifact\F\Windows\System32\config
Mode                 LastWriteTime         Length Name
----                 -------------         ------ ----
-a----         9/11/2025   1:48 AM         524288 DEFAULT
-a----         9/11/2025   6:03 AM         131072 SAM
-a----         9/11/2025   1:48 AM          65536 SECURITY
-a----         9/29/2025   2:17 AM       78905344 SOFTWARE
-a----         9/11/2025   1:48 AM       12582912 SYSTEM
And there are other hives we need apart from the above ones, also need:
- NTUSER.DAT --> path \F\Users\art-test\Desktop\AppData\Local\Microsoft\Windows
- UserClass.dat --> path \F\Users\art-test
Let's group all the files in one folder that will be easier for analysis, so I group them in one folder.
dir some of the files are hidden, but using attrib we can see them:
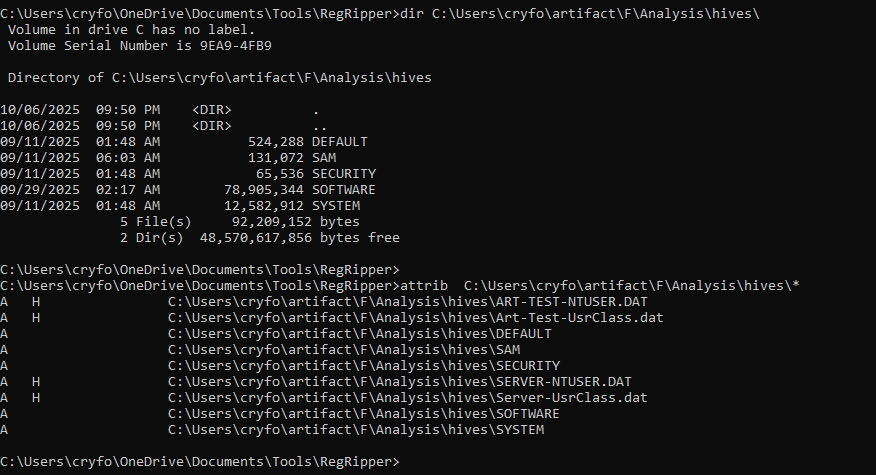
We need to make them not hidden. Therefore by the use of attrib with -h flag we can remove the hidden attribute.
So by running these commands:
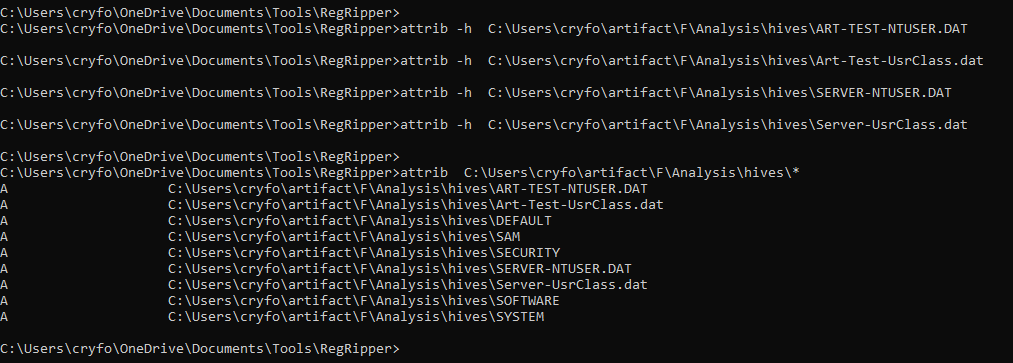
cmdattrib -h  C:\Users\cryfo\artifact\F\Analysis\hives\Server-UsrClass.dat
attrib -h  C:\Users\cryfo\artifact\F\Analysis\hives\SERVER-NTUSER.DAT
attrib -h  C:\Users\cryfo\artifact\F\Analysis\hives\Art-Test-UsrClass.dat
attrib -h  C:\Users\cryfo\artifact\F\Analysis\hives\ART-TEST-NTUSER.DAT
We can get rid of the hidden attribute as you can see below:
The hidden attribute is a common technique used by both the operating system and malware to conceal files. From a forensic perspective, we must always check for hidden files and attributes. The attrib command modifications we made are documented as part of our evidence handling procedure. It's important to note that we're working on copies of the original evidence, not the live system, so these changes don't affect the integrity of our original evidence.
So we have gotten our clean collected hives. Now we need to start digging deeper into them to see what we can find.
In a nutshell, registry hives are like a central database on Windows that collect user and system activity such as when a folder is created, open files, running services, and also it keeps users and system configuration.
The Windows Registry is actually composed of several discrete files called "hives." Each hive contains a structured database of keys and values. The main system hives are:
- SAM: Security Account Manager - contains user and group information
- SECURITY: contains security policy and privileges
- SOFTWARE: contains system-wide software configuration
- SYSTEM: contains system configuration and hardware information
- DEFAULT: contains the default user profile
- NTUSER.DAT: contains individual user settings and configurations
- UsrClass.dat: contains user-specific COM and shell information
Each hive is divided into cells that can contain keys, values, or data. The registry uses a bin-based allocation system, and forensic tools can often recover deleted registry keys from slack space within these bins.
Registry Analysis with RegRipper
So let's begin with regripper. Therefore we can use regripper to extract the content we would like from the hives.
We can run the below important plugins to extract the info:
cmd# --- NTUSER.DAT (User Activity) ---
rip.exe -r NTUSER.DAT -p userassist      # Program execution evidence
rip.exe -r NTUSER.DAT -p runmru          # Run dialog commands history
rip.exe -r NTUSER.DAT -p typedurls       # Typed URLs in Internet Explorer
rip.exe -r NTUSER.DAT -p shellbags       # Folder/file access history
rip.exe -r NTUSER.DAT -p mru             # Recently accessed files

# --- SOFTWARE Hive (System & Apps) ---
rip.exe -r SOFTWARE -p uninstall         # Installed applications
rip.exe -r SOFTWARE -p compname          # Computer name
rip.exe -r SOFTWARE -p officeMRUs        # MS Office recent files
rip.exe -r SOFTWARE -p apppaths          # Executables run via App Paths
rip.exe -r SOFTWARE -p profileslist      # User profiles on system

# --- SYSTEM Hive (Configuration & Network) ---
rip.exe -r SYSTEM -p timezone            # Time zone settings
rip.exe -r SYSTEM -p shutdown            # Last shutdown time
rip.exe -r SYSTEM -p networkcards        # Network interfaces
rip.exe -r SYSTEM -p services            # Installed services/drivers
rip.exe -r SYSTEM -p mounteddevices      # Drive letter & volume info

# --- SAM Hive (Accounts) ---
rip.exe -r SAM -p samparse               # User accounts and groups

# --- SECURITY Hive (Policies) ---
rip.exe -r SECURITY -p polacls           # User rights assignments

# --- Run all plugins on a hive (full dump) ---
rip.exe -r NTUSER.DAT -a
rip.exe -r SOFTWARE -a
rip.exe -r SYSTEM -a
rip.exe -r SAM -a
rip.exe -r SECURITY -a
But this process will consume a lot of time. As a result of that, we can run a simple automated command on our command prompt which will execute and parse all the hives into an output folder as a text file, then we will navigate through it and search what we are looking for.
We can use this small script:
cmdset "HIVES=C:\Users\cryfo\artifact\F\Analysis\hives"
set "OUTPUT=C:\Users\cryfo\artifact\F\Analysis\Registry_Parsed_Results"

if not exist "%OUTPUT%" mkdir "%OUTPUT%"

for %f in ("%HIVES%\*") do (
    echo Processing %~nxf ...
    rip.exe -r "%f" -a > "%OUTPUT%\%~nf.txt"
)

echo.
echo All hive files processed successfully!
echo Results stored in: %OUTPUT%
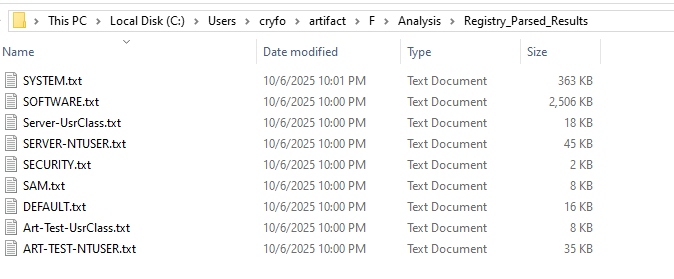
So we have successfully parsed the hives:
Complementary Analysis with Registry Explorer
So after parsing the hives, let's also load the hives in Registry Explorer for better analysis.
So the first thing is to open the registry explorer and load the hives. It will look something like:
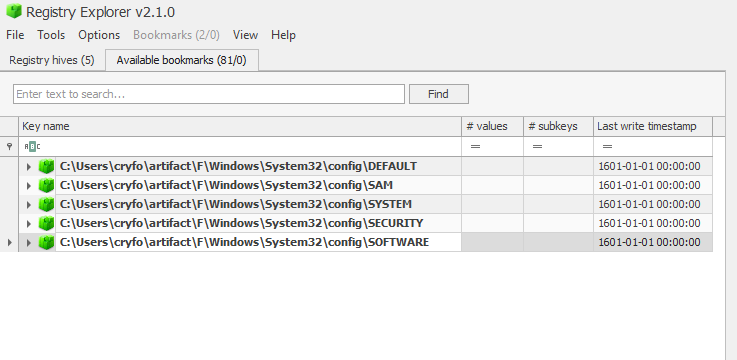
Registry Explorer provides a graphical interface that allows us to navigate the registry hierarchy visually. This is particularly useful for understanding the structure and relationships between different keys. It also provides advanced features like timeline analysis, search capabilities, and the ability to bookmarks important findings. Using multiple tools (RegRipper and Registry Explorer) is a best practice in digital forensics as it provides verification of findings through tool correlation.
Note that we did not upload the following hives:
- USRCLASS.DAT - C:\Users<username>\AppData\Local\Microsoft\Windows\UsrClass.dat - User interface & shell activity
- Amcache.hve - C:\Windows\AppCompat\Programs\Amcache.hve - Program execution history
- RecentFileCache.bcf - C:\Windows\AppCompat\Programs - Recently used programs
We will have a look at it separately but not on registry explorer.
Beginning the Detailed Analysis
Let's begin... We will be asking ourselves questions and getting the answers.
User Account Analysis
Now, Questions:
- Which users exist on the system?
- When were accounts created or last logged in?
- Were any accounts added recently?
Where are we gonna find these answers? Here:
- SAM → SAM\Domains\Account\Users\Names
- SYSTEM → Select\ControlSet001\Services
- SOFTWARE\Microsoft\Windows NT\CurrentVersion\ProfileList
To see how many users existing on the system, we will navigate to the SAM on registry explorer:
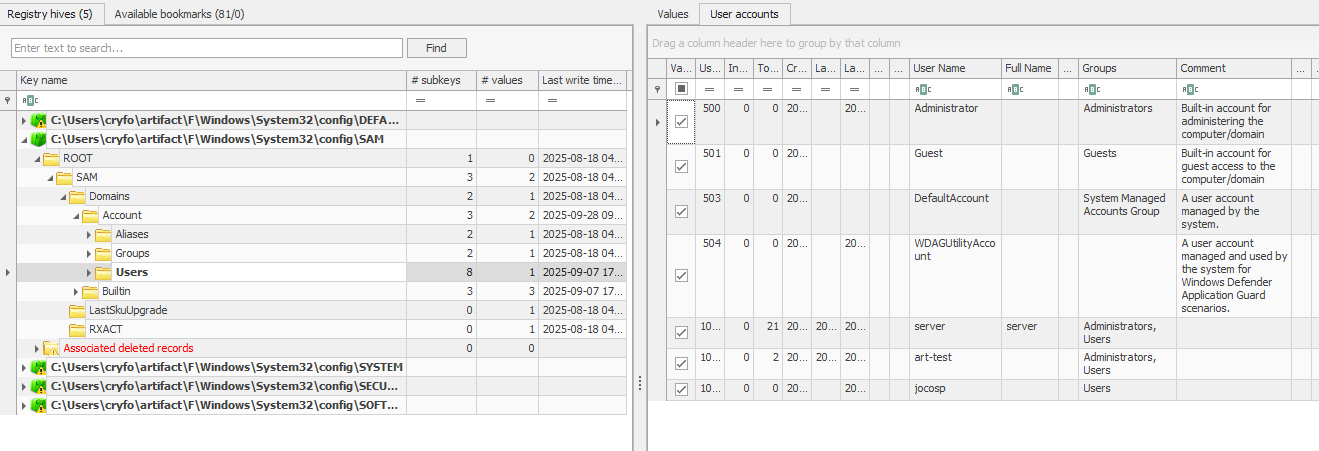
So as we can see there are few users on the system. The users are server, jocosp, art-test and default guest user with an administrator user. So amongst the above users, there are two which stand out which are art-test and jocosp user - they look malicious.
Let's export the SAM file as a CSV and open it with a timeline explorer for better visibility:
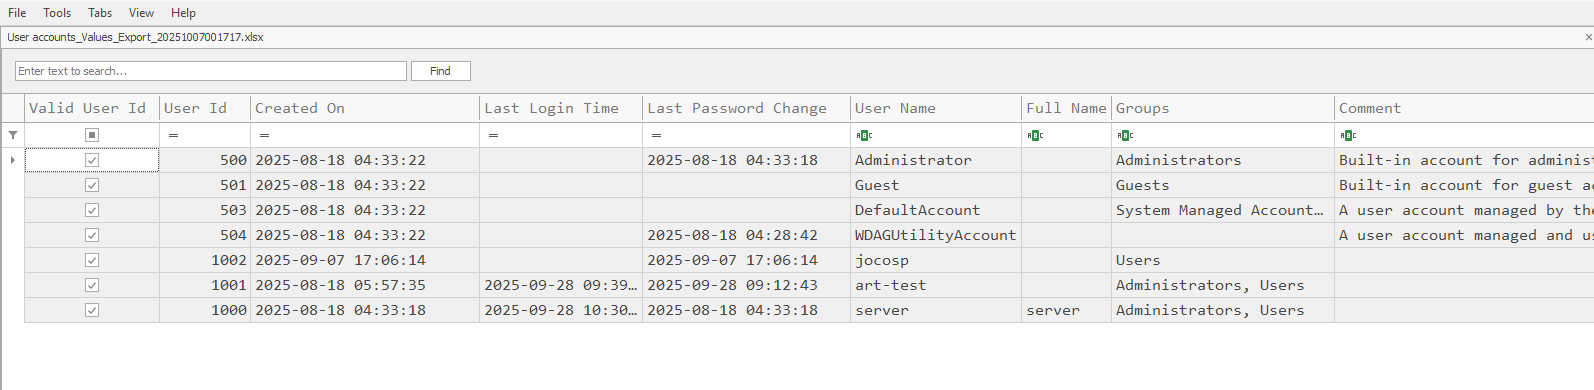
So now we can see all the fields clearly. I removed all the other fields because they are empty such as last logon.
Created On:
- jocosp was created on -> 2025-09-07 17:06:14
- art-test was created on -> 2025-08-18 05:57:35
- server was created on -> 2025-08-18 04:33:18
Also from the last logon we can see the jocosp account was never logged in but others:
Last Login Time:
- last logon of art-test was on -> 2025-09-28 09:39:02
- last logon of server was on -> 2025-09-28 10:30:53
Also we can see that the groups the users belong to:
Group:
- jocosp belongs to -> Users group
- art-test belongs to -> Administrators, Users
- server belongs to -> Administrators, Users
So the two suspicious users we have are running in administrator groups which is something critical and we must look into it.
The SAM hive contains crucial account information in a binary format that requires specialized parsing. The user account data includes RID (Relative Identifier) numbers, account creation dates, last login times, password hashes, and group memberships. The fact that jocosp was created recently and has never been used is highly suspicious - this could indicate a backdoor account created by an attacker. The art-test account having administrative privileges without clear business justification is also a red flag. In forensic investigations, we always look for accounts created outside of normal business hours or maintenance windows.
System Boot and Time Information Analysis
Moving to the next questions.
The next thing we should look into is System Boot and Time Information and we have to answer the following questions.
Question:
- When was the system last booted or shut down?
- What timezone and OS version are configured?
We can get the above info from:
- SYSTEM\CurrentControlSet\Control\TimeZoneInformation
- SYSTEM\CurrentControlSet\Control\Windows
- SOFTWARE\Microsoft\Windows NT\CurrentVersion
And we will focus on extracting the Last boot time, timezone bias, OS version/build, install date.
We can see the timezone is set to Pacific Standard Time and other related information:
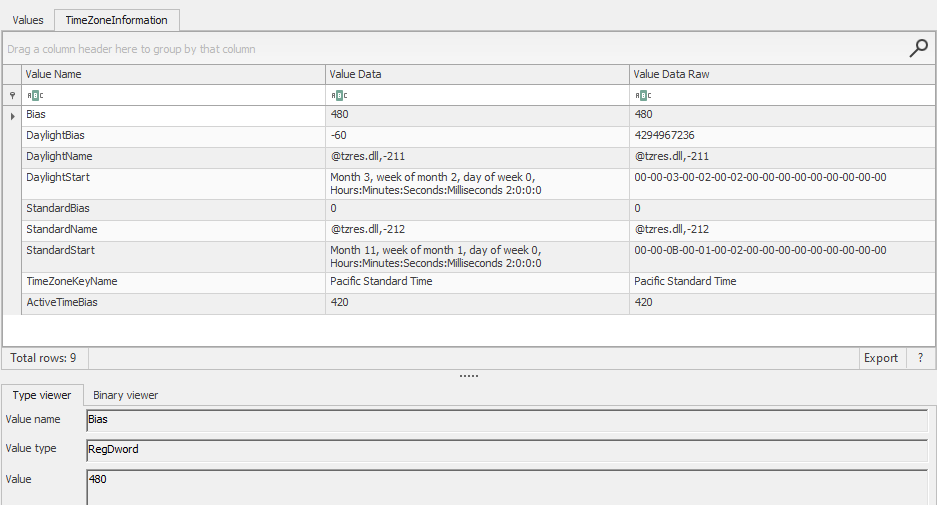
So we can see the time zone. Let's look at the last boot time:
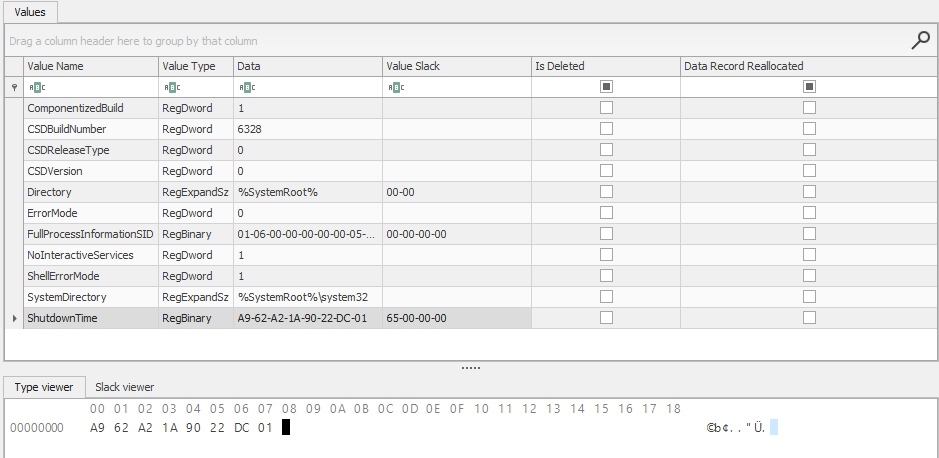
We can see the last shutdown time was given to us in hex. We can either use CyberChef or create a small script that will do that for us.
The below is a script that does that for us:
python3import struct, datetime

data = bytes.fromhex("A9 62 A2 1A 90 22 DC 01")
filetime = struct.unpack("<Q", data)[0]
dt = datetime.datetime.utcfromtimestamp((filetime - 116444736000000000) / 10000000)
print(dt)
We got the shutdown time as 2025-09-10 20:18:43.175697
So looking at the version, install date and others we will navigate to the CurrentVersion path under Windows NT:
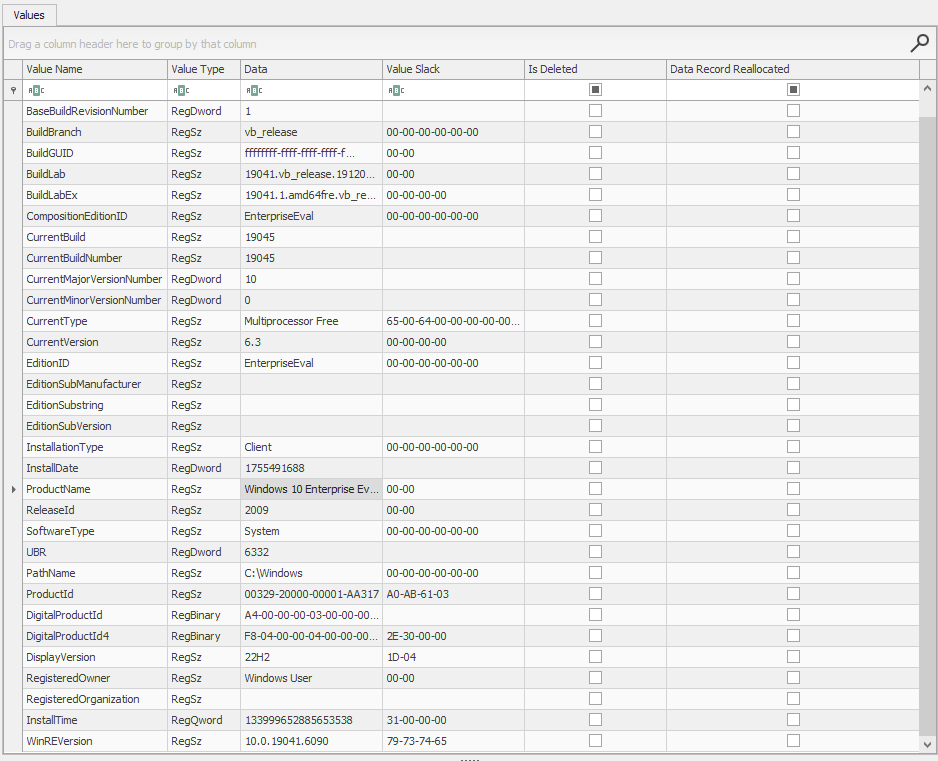
We can see the following info:
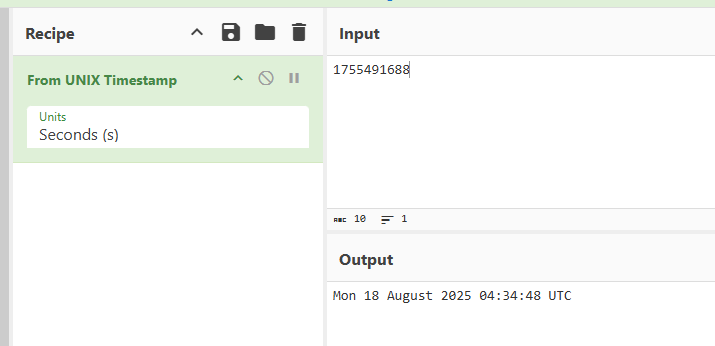
- InstallDate -> 1755491688 which is equal to Mon 18 August 2025 04:34:48 UTC
As we can see it's converted in CyberChef in image below:
We can also see the current version is set to CurrentVersion -> 6.3 The ProductName name is Windows 10 Enterprise Evaluation and other information as well.
Windows uses 64-bit FILETIME structures that represent the number of 100-nanosecond intervals since January 1, 1601 (UTC). This is why we subtract 116444736000000000 (the number of 100-nanosecond intervals between January 1, 1601 and January 1, 1970) and divide by 10,000,000 to convert to Unix timestamp. Timezone information is crucial for correlating events across different systems and ensuring accurate timeline reconstruction.
Startup and Persistence Analysis
Moving on, the next thing we are gonna look at is Startup and Persistence as many malware the first thing that they do is persistence or set up a backdoor that will be used for communication with C2.
We are gonna answer few questions from this part. The questions are as follows:
Question:
- What programs or malware start automatically at boot/login?
- Are there suspicious persistence entries?
We are going to look for this and answer the questions from these paths:
- SOFTWARE\Microsoft\Windows\CurrentVersion\Run
- NTUSER.DAT\Software\Microsoft\Windows\CurrentVersion\Run
- SOFTWARE\Microsoft\Windows\CurrentVersion\RunOnce
- SYSTEM\CurrentControlSet\Services
Note: It's worthy noting that there are many persistence techniques that attackers can employ so it's good to familiarize yourself with those techniques and hunt them in your environment.
Additional paths to consider:
md## Current User
HKEY_CURRENT_USER\Software\Microsoft\Windows\CurrentVersion\Run
HKEY_CURRENT_USER\Software\Microsoft\Windows\CurrentVersion\RunOnce
HKEY_CURRENT_USER\Software\Microsoft\Windows\CurrentVersion\Policies\Explorer\Run
HKEY_CURRENT_USER\Software\Microsoft\Active Setup\Installed Components

## Local Machine
HKEY_LOCAL_MACHINE\Software\Microsoft\Windows\CurrentVersion\Run
HKEY_LOCAL_MACHINE\Software\Microsoft\Windows\CurrentVersion\RunOnce
HKEY_LOCAL_MACHINE\Software\Microsoft\Windows\CurrentVersion\RunOnceEx
HKEY_LOCAL_MACHINE\Software\WOW6432Node\Microsoft\Windows\CurrentVersion\Run
HKEY_LOCAL_MACHINE\Software\Microsoft\Active Setup\Installed Components
HKEY_LOCAL_MACHINE\Software\Microsoft\Windows NT\CurrentVersion\Winlogon\Shell
HKEY_LOCAL_MACHINE\Software\Microsoft\Windows NT\CurrentVersion\Winlogon\Userinit
HKEY_LOCAL_MACHINE\SYSTEM\CurrentControlSet\Services

## Start up
%APPDATA%\Microsoft\Windows\Start Menu\Programs\Startup          (User)
%PROGRAMDATA%\Microsoft\Windows\Start Menu\Programs\Startup      (All Users)

## Schedule Task
C:\Windows\System32\Tasks\
HKEY_LOCAL_MACHINE\SOFTWARE\Microsoft\Windows NT\CurrentVersion\Schedule\TaskCache\

## DLL Injection -> advance persistence
HKEY_LOCAL_MACHINE\Software\Microsoft\Windows NT\CurrentVersion\Windows\AppInit_DLLs
HKEY_LOCAL_MACHINE\Software\Microsoft\Windows NT\CurrentVersion\Windows\LoadAppInit_DLLs

## File Image Execution
HKEY_LOCAL_MACHINE\SOFTWARE\Microsoft\Windows NT\CurrentVersion\Image File Execution Options\

## Service Control Manager
Note: to analyze you can go to the parse hives and search for `services .v`
HKEY_LOCAL_MACHINE\SYSTEM\CurrentControlSet\Services\

## shell Extension
HKEY_CLASSES_ROOT\*\shellex\ContextMenuHandlers\
HKEY_CLASSES_ROOT\Directory\shellex\ContextMenuHandlers\

## COM Object hijacking
HKEY_CURRENT_USER\Software\Classes\CLSID\
HKEY_LOCAL_MACHINE\Software\Classes\CLSID\

## WMI Persistence
Namespace: root\subscription
Class: __EventFilter, __EventConsumer, __FilterToConsumerBinding
For now let's just look at the above registry paths. There are many information we should keep our eyes on such as Autoruns, paths to executables, suspicious scripts or renamed files etc.
While I found some entries at SOFTWARE\Microsoft\Windows\CurrentVersion\Run, we found %SystemRoot%\system32\VBoxTray.exe which is a normal entry for virtualbox. It's VBoxTray.exe is part of Oracle VirtualBox Guest Additions specifically, the VirtualBox Guest Additions Tray Application.
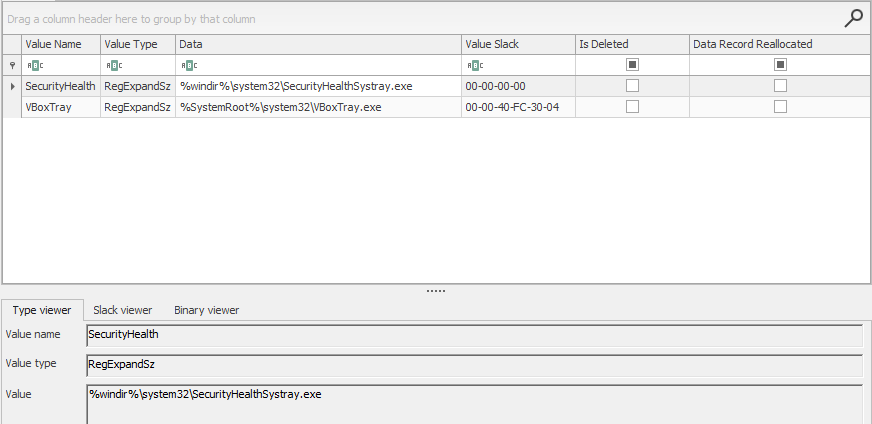
Note: not all entries are malicious - there may be some legitimate programs placed there to make them run when the system is booted, so it's worthy checking the entries and make sure they are not malicious.
So while looking at HKEY_LOCAL_MACHINE\SOFTWARE\Microsoft\Windows NT\CurrentVersion\Schedule\TaskCache\:
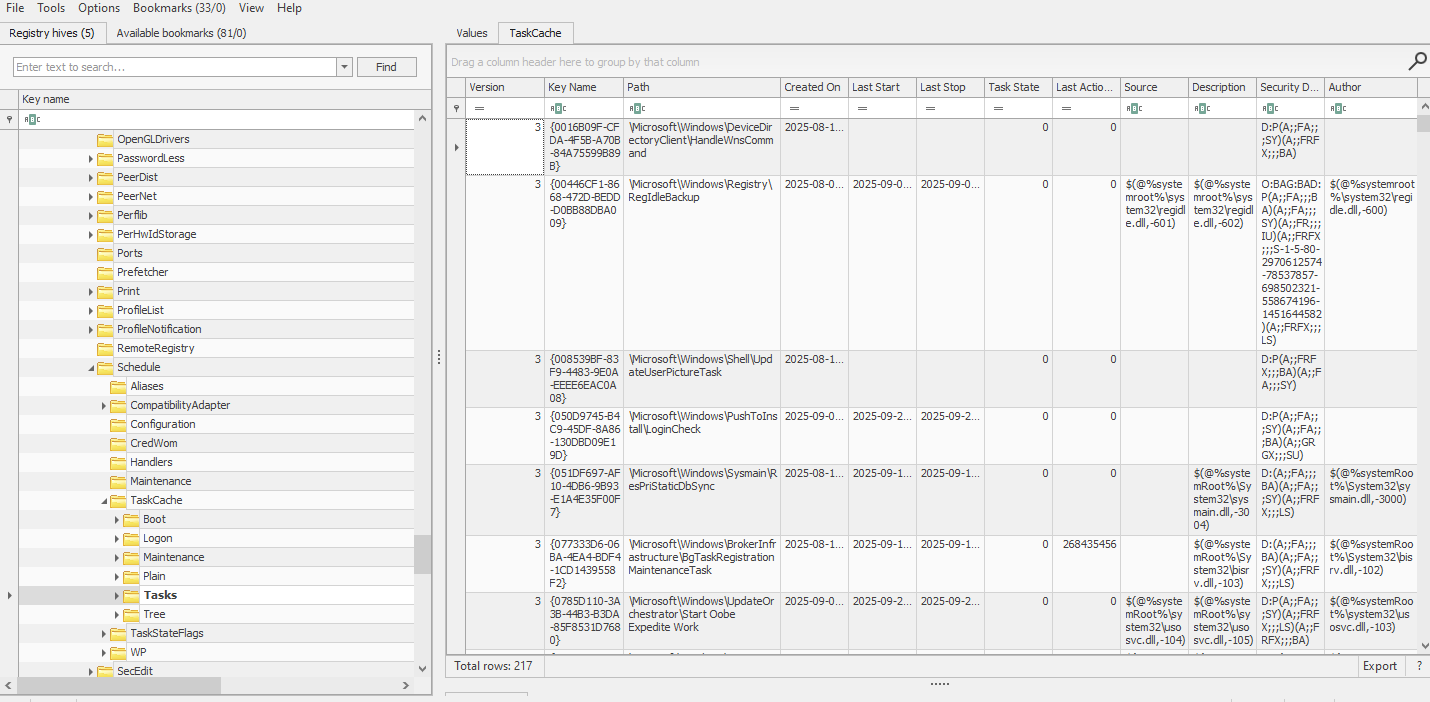
So we can see many scheduled task sets. Let's export the file and see its content clearly:
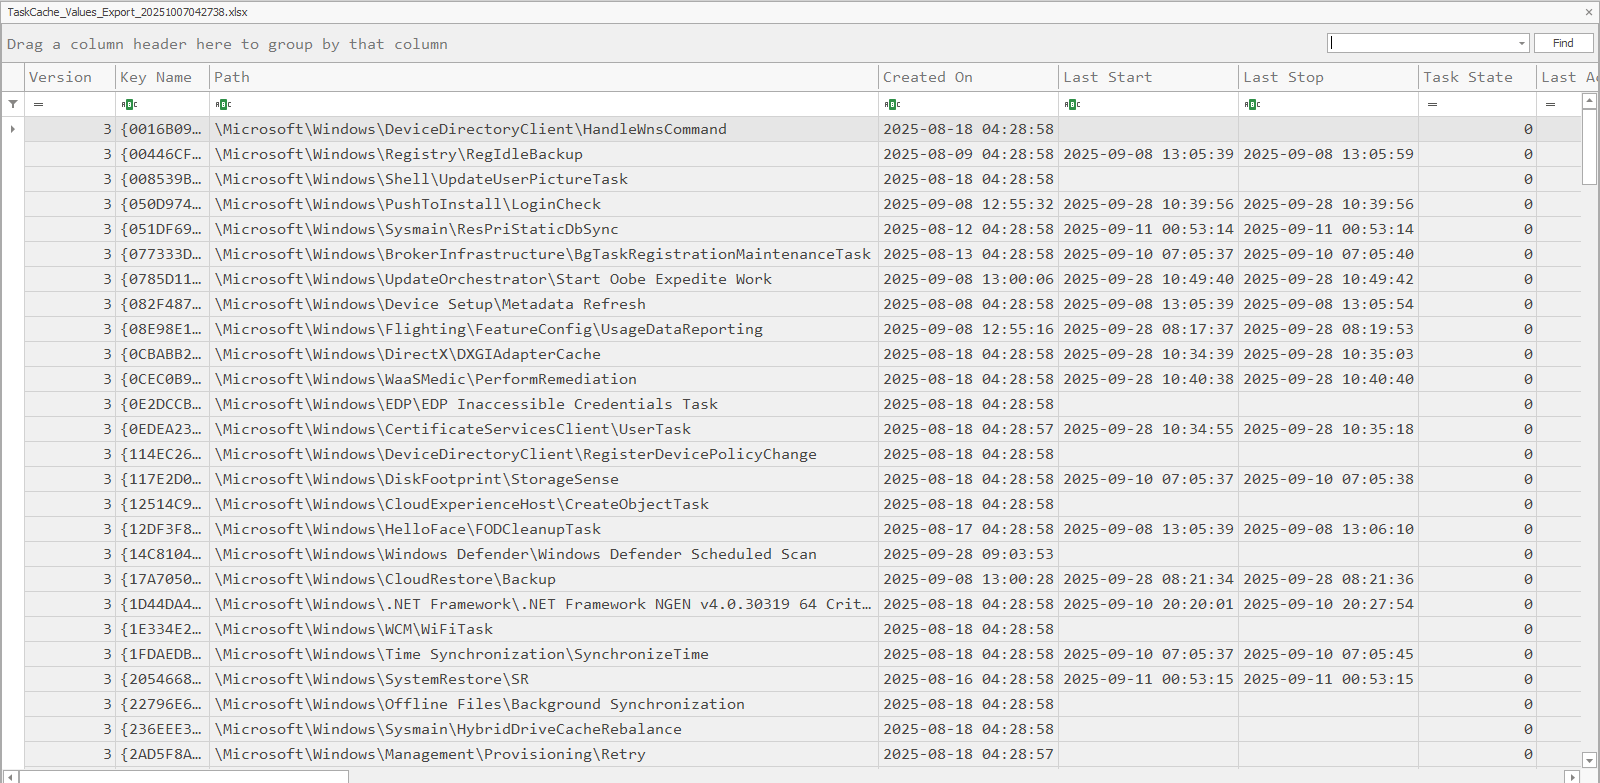
As you can see there are many auto run tasks, but we will leverage autoruns system internals to see which ones are running and when.
Persistence mechanisms are ways that malware ensures it continues to run after system reboots or user logoffs. The registry contains numerous persistence locations, and advanced attackers often use less common ones to avoid detection. Scheduled Tasks are particularly dangerous because they can be configured to run with SYSTEM privileges and can be triggered by various events, not just system startup.
Autoruns Analysis
After loading the autorun GUI we will wait for it to parse the files. So let's start with the logons - these are programs that start when a user logs in:
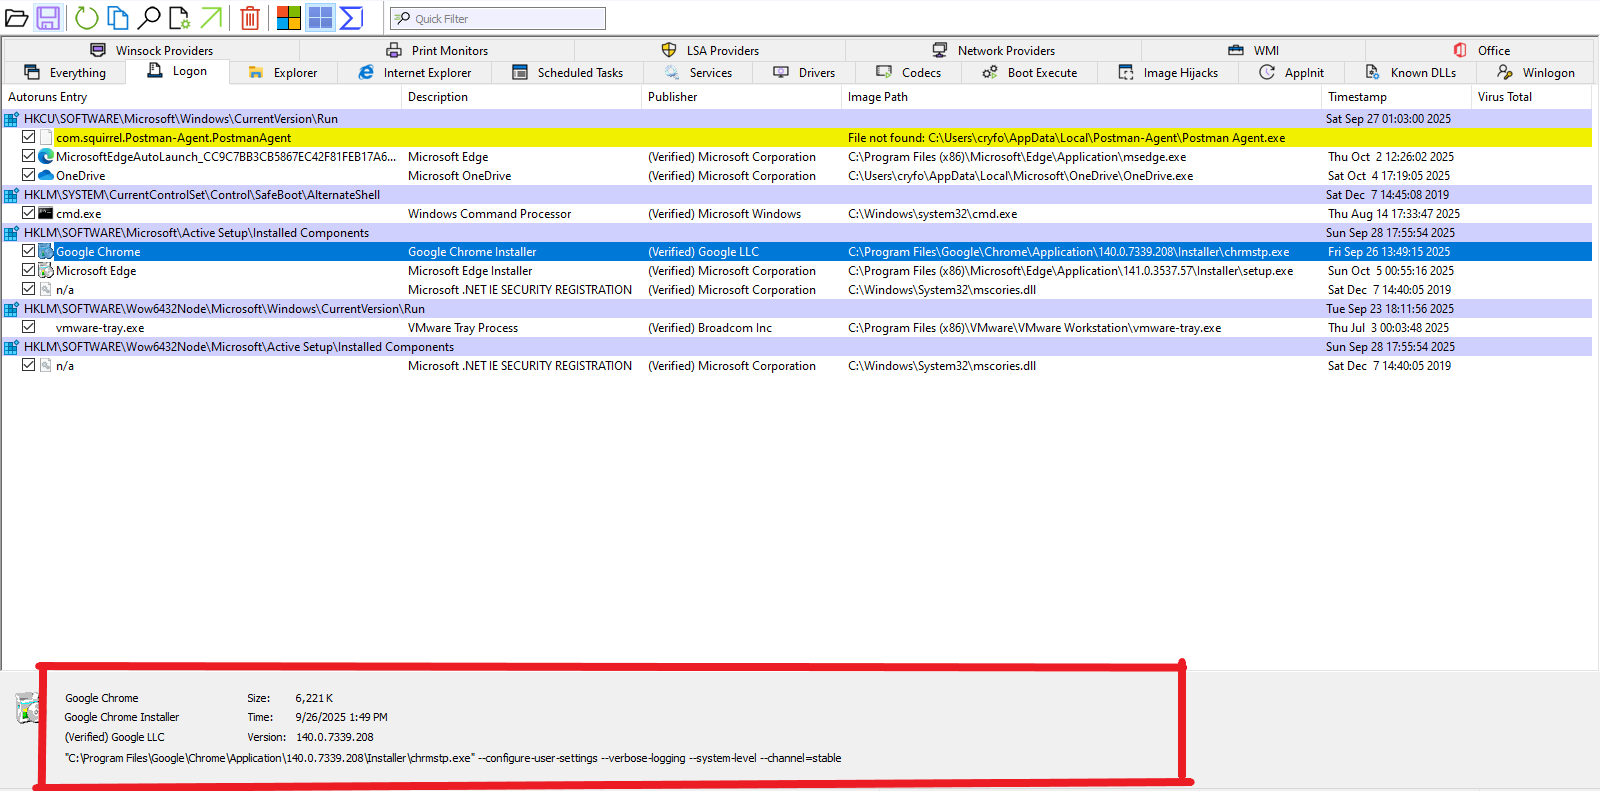
As we can see there are many programs. We click on one and we see the command runs below, so in case it's suspicious we can look closely.
And also we can see more columns such as scheduled task etc:
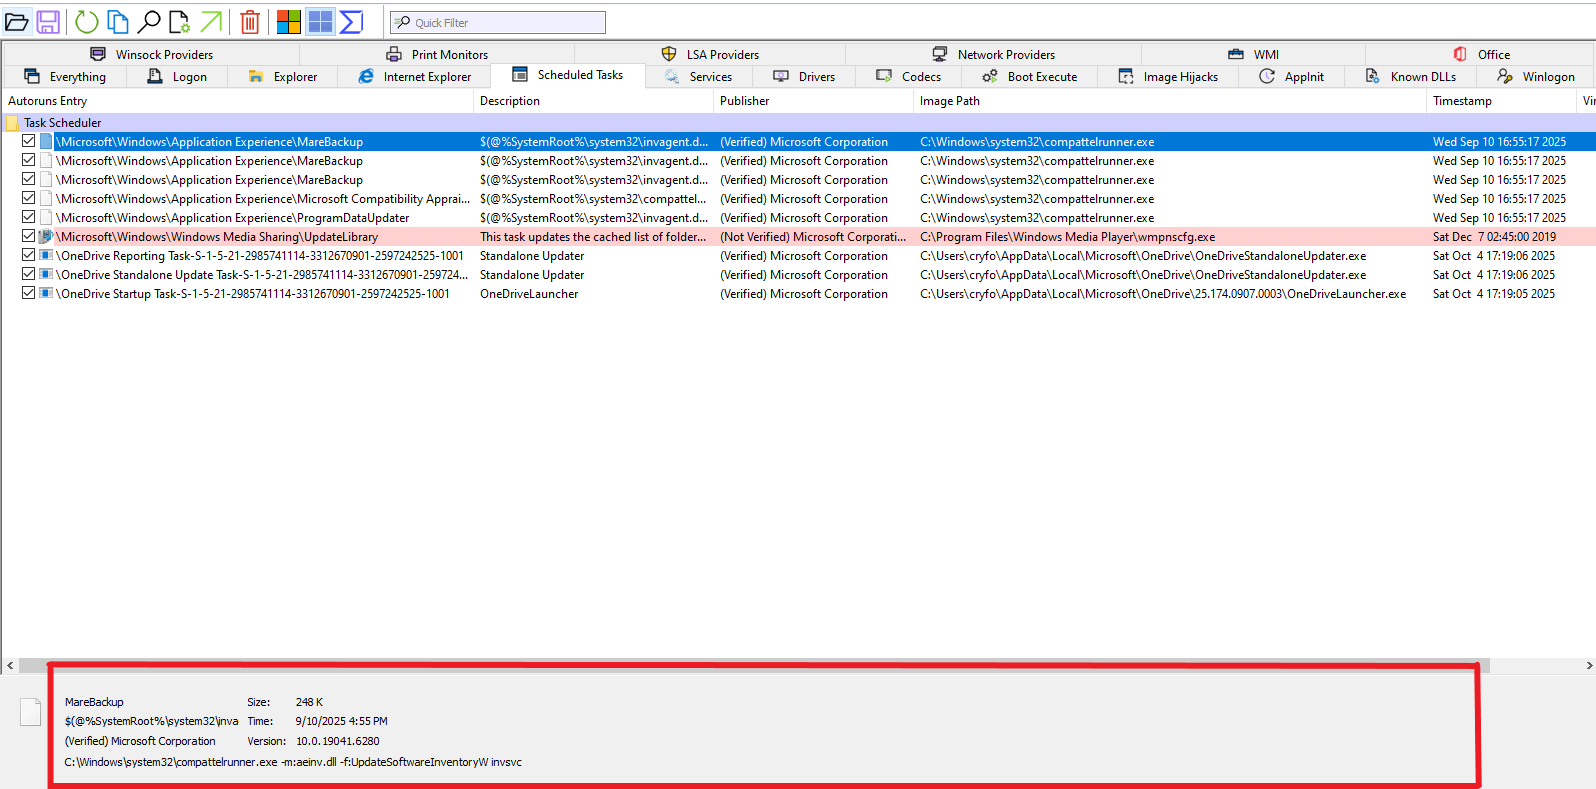
As we have seen there are few scheduled tasks. The ones that stand out should be the ones that have not verified publisher because there might be suspicious. Let's take a look at one of them.
So opening the path to the tasks shows us:
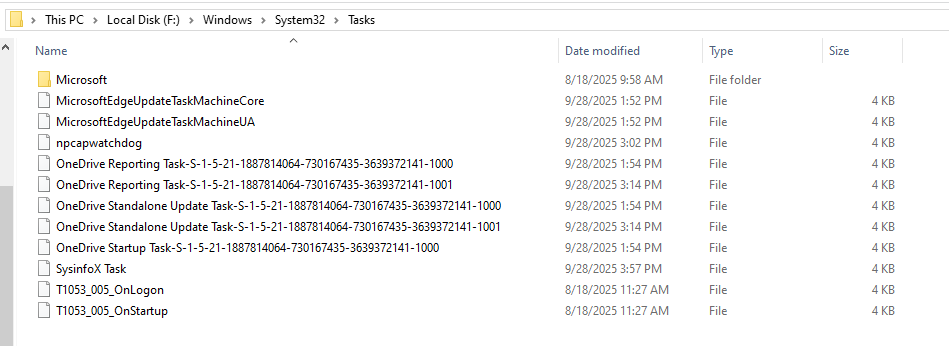
So by opening the C:\Windows\System32\Tasks we see many tasks there in the folder while others did not open in the autoruns - it's worthy checking the path. The last 3 look suspicious - let's see them one by one.
So I open one of the files in vim text editor:
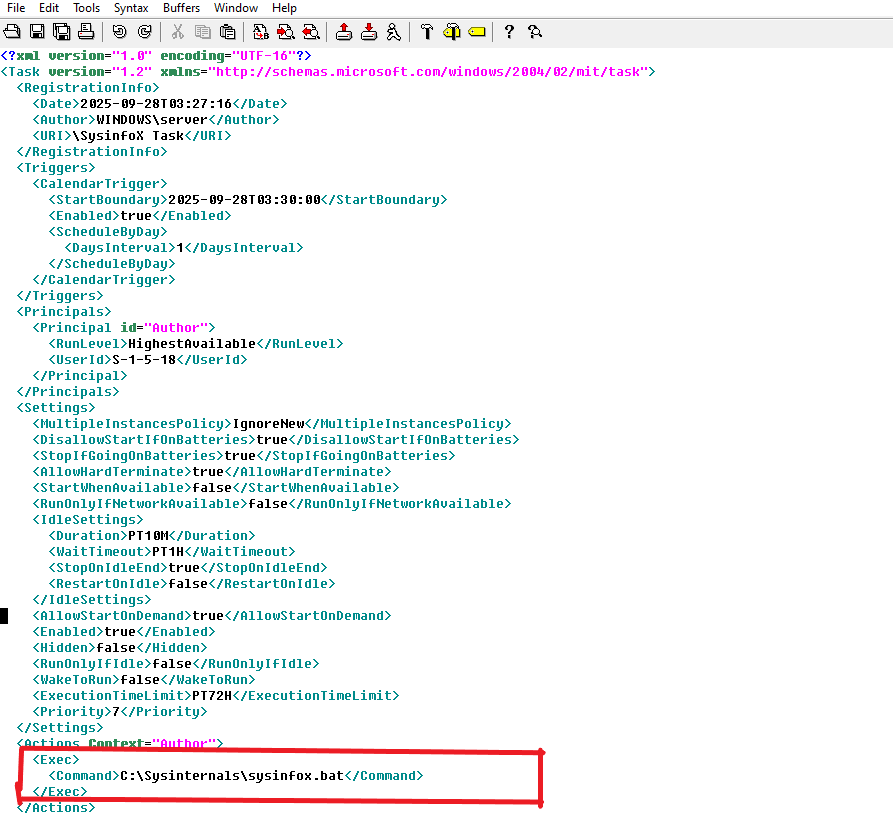
We can see it's scheduled to execute a bat file called sysininfo.bat which may be doing something malicious and it's located in sysinternals. Let's see its content:
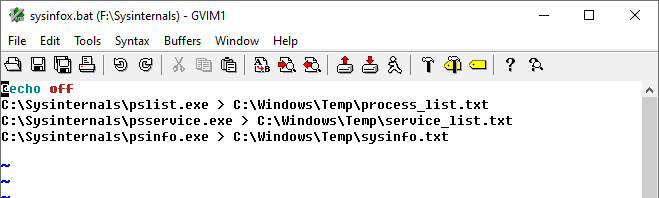
We can see the file is gathering system information such as running processes etc. Indeed it's malicious.
The other two files are opening calculator:
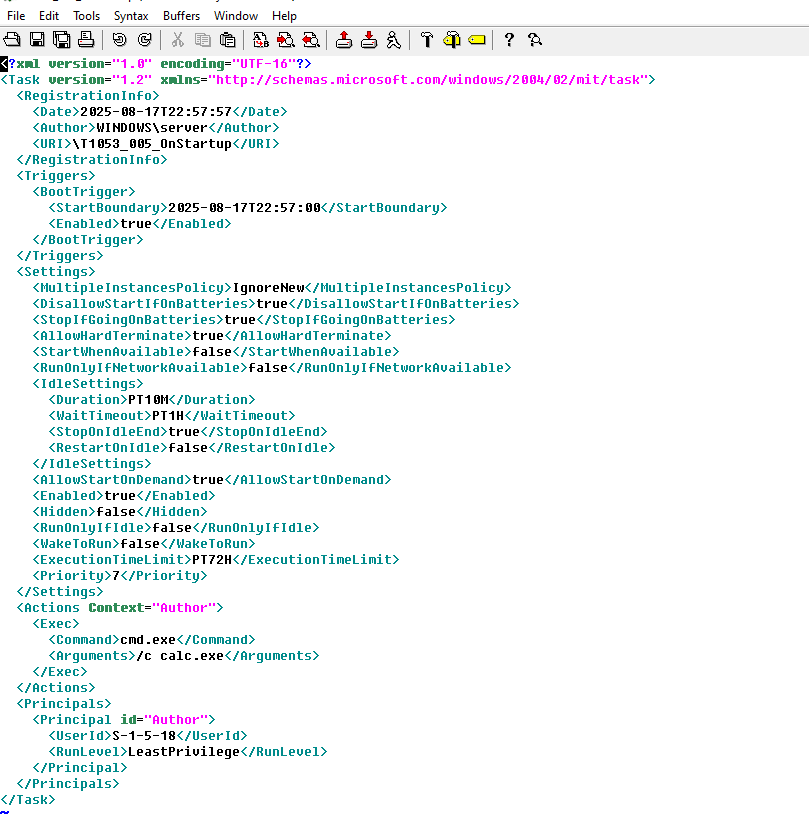
So we have to assess all the executables that those scheduled tasks are running and see what we can pull out of them. That's what's supposed to be done in a real world environment, but as for this we stopped here.
Scheduled Tasks can be powerful persistence mechanisms because they can run with elevated privileges and can be triggered by various system events. The XML-based task format (.job files) contains detailed information about triggers, actions, and conditions. Malicious tasks often use names that resemble legitimate system tasks to avoid suspicion. The presence of information gathering scripts (like sysininfo.bat) is particularly concerning as it suggests reconnaissance activity.
User Activity and File Access Analysis
The next is we will look at User Activity and File Access and we will be able to answer some questions from there, such as:
- What files/folders were accessed recently?
- Which documents were opened or edited?
- Any external drives connected?
Knowing what files are recently opened will help in understanding what the attacker did, such as opening documents, PDFs or configuration files on the system - all of these are very important for our analysis.
We will be looking at this information in the following paths:
- NTUSER.DAT\Software\Microsoft\Windows\CurrentVersion\Explorer\RecentDocs
- NTUSER.DAT\Software\Microsoft\Windows\CurrentVersion\Explorer\ComDlg32\OpenSavePidlMRU
- SYSTEM\MountedDevices
- SYSTEM\CurrentControlSet\Enum\USBSTOR
And extract some information such as File names, access times, USB device serial numbers.
In the USB path, we can see two connected USB in the system:
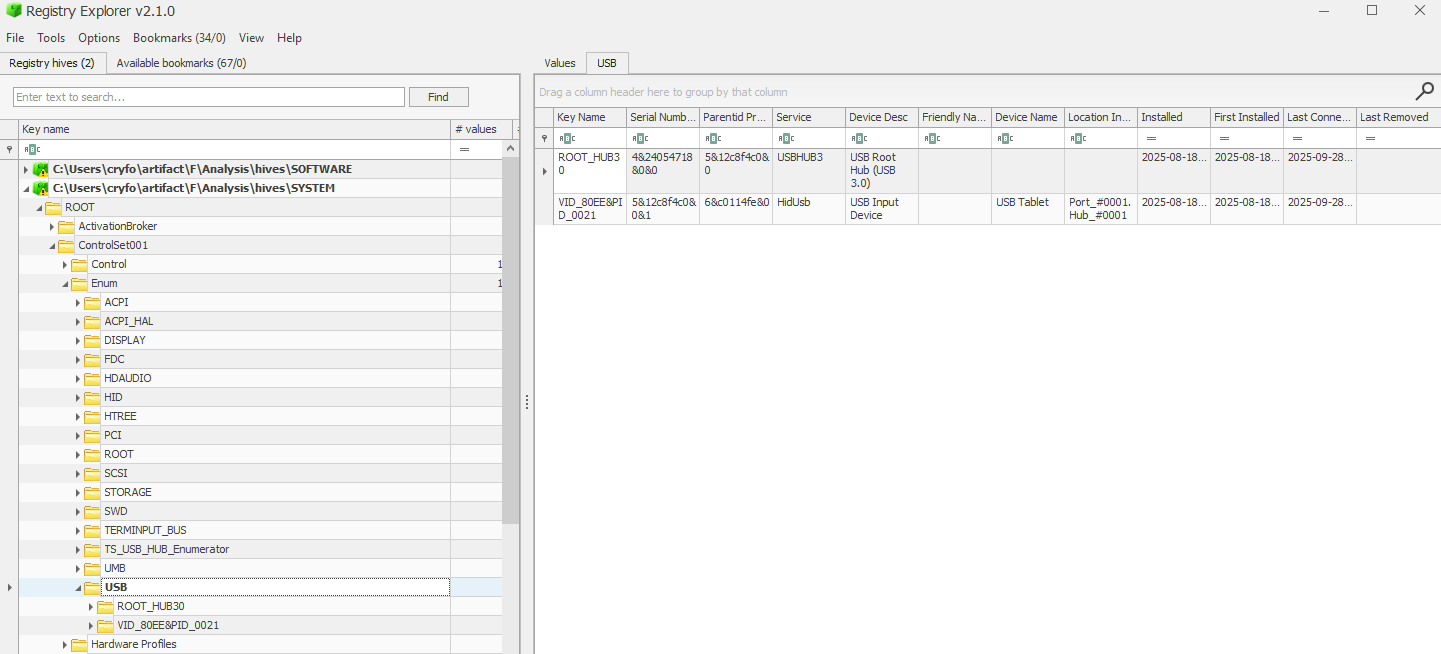
There are only two USB devices. Let's export the file and open it in timeline explorer:
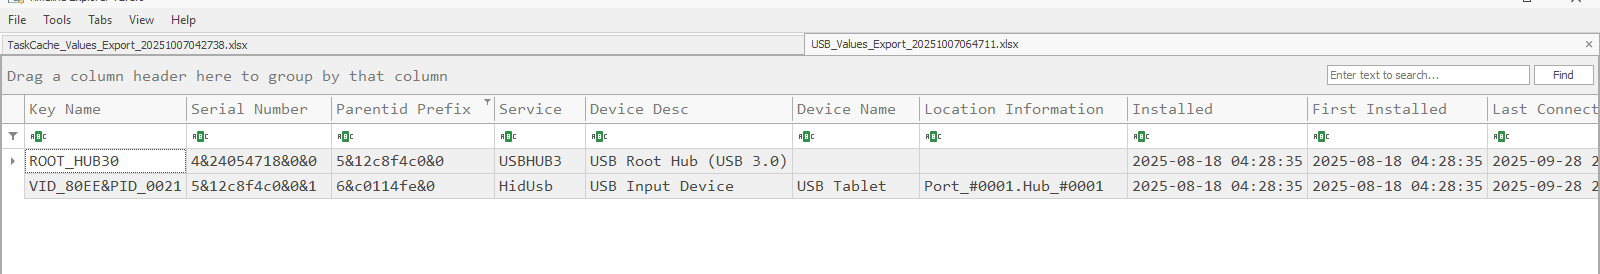
We can see all the information of the USB such as its serial number, the service name, key, when it was first connected and also last connected, location and more. This information is very crucial for forensics.
Also we can see there are few devices mounted on the machine which is very crucial:
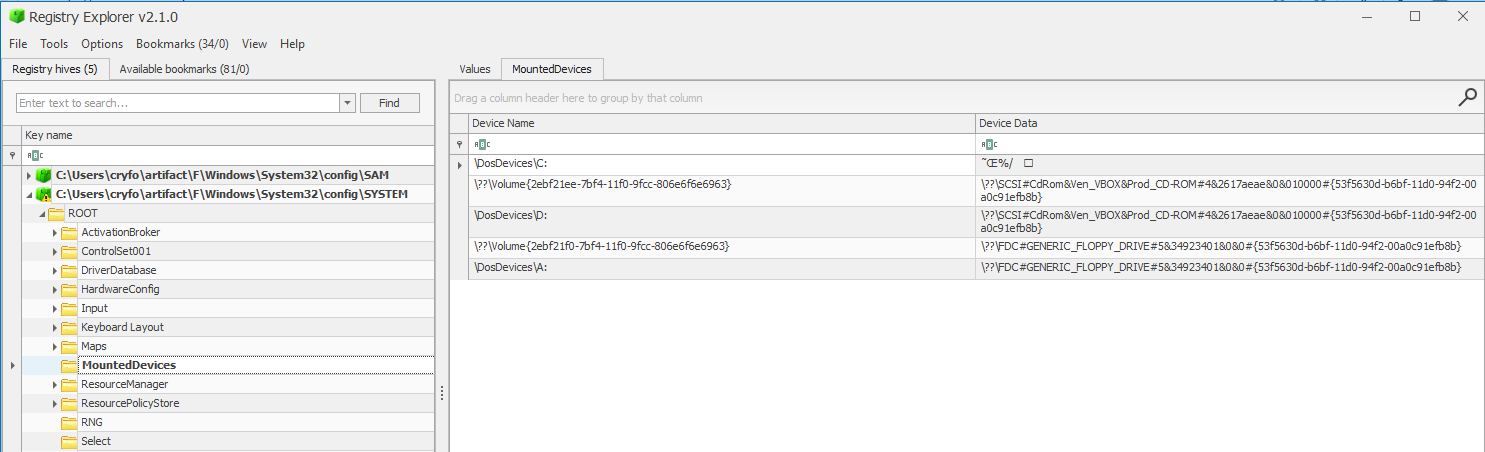
This information is crucial - we can find what USB drive is inserted when, where and the details of the drive.
The USBSTOR key maintains a history of all USB devices that have been connected to the system, even after the devices are removed. This is invaluable for investigating data exfiltration or introduction of malware via removable media. The MountedDevices key tracks drive letter assignments and volume mappings. RecentDocs and ComDlg32 keys track user file access through Explorer and common dialogs, providing evidence of document access even if the files themselves have been deleted.
Network Activity Analysis
The next is to look for network activity which the machine is connected to. We will be looking at Network and Internet Activity and answer some questions from that.
The Questions:
- What Wi-Fi networks or VPNs were connected?
- What were the last known IP addresses?
And the location of the artifact will be at the following registry keys:
- SOFTWARE\Microsoft\Windows NT\CurrentVersion\NetworkList\Profiles
- SYSTEM\CurrentControlSet\Services\Tcpip\Parameters\Interfaces
- NTUSER.DAT\Software\Microsoft\Windows\CurrentVersion\Internet Settings
And the juicy info to extract from those parts will be such as SSIDs, MAC addresses, IPs, DHCP lease times.
So now let's go to those parts. Since we parsed our hives with regripper we can simply open those .txt files and search through it - it will be easier for us than navigating through the registry explorer:
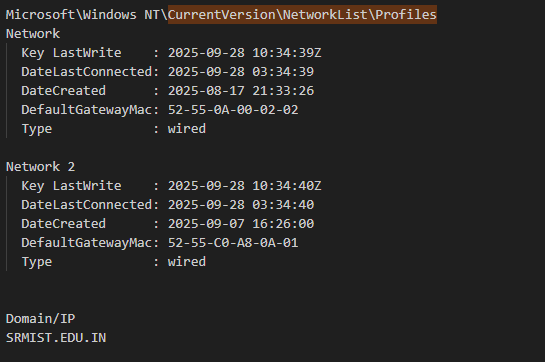
We can see the network information including the domain and connection type which is indicated as wired. Actually the machine is on a virtualbox and connected to my school network as you can see the domain right there, and also including the timestamp of the connections which is very important for digital forensic.
Looking at the network information in details...
So in the HKEY_LOCAL_MACHINE\SYSTEM\CurrentControlSet\Services\Tcpip\Parameters path we can see some details about the network. From the below picture we can see the dhcp domain name, dhcp server and the hostname:
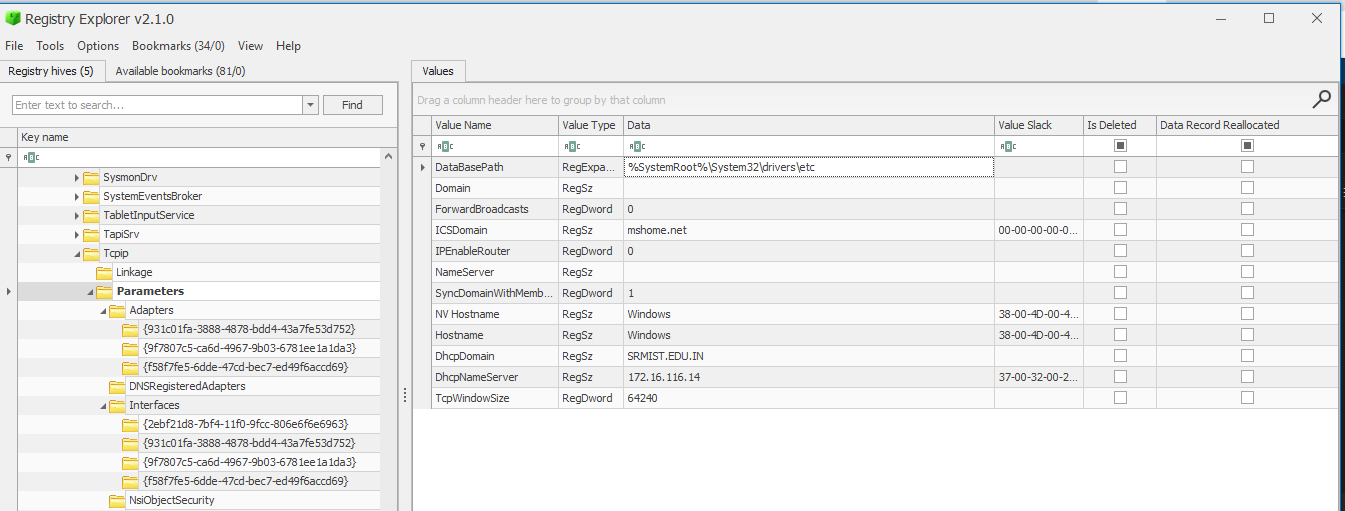
We can see the adapters listed below the parameter, including the interfaces connected to the machine. Let's see the interfaces and the adapters one after the other to see what they contain.
The first interface as you can see below shows us a lot of information about the interfaces, such as IP, dhcpserver, dhcpdomain, etc.
The below picture shows us the details of interface 1:
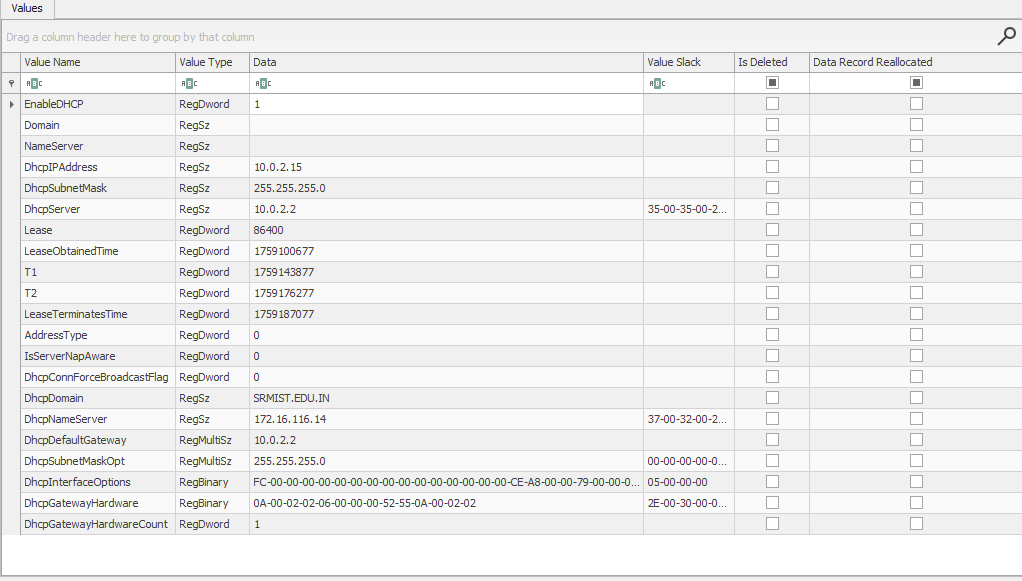
And you can see we obtain many details related to the network such as dhcpservers, IP address, subnet etc. And we can see the domain which is the domain of my university which shows I'm connected to my university network.
The below image again shows the second interface's details:
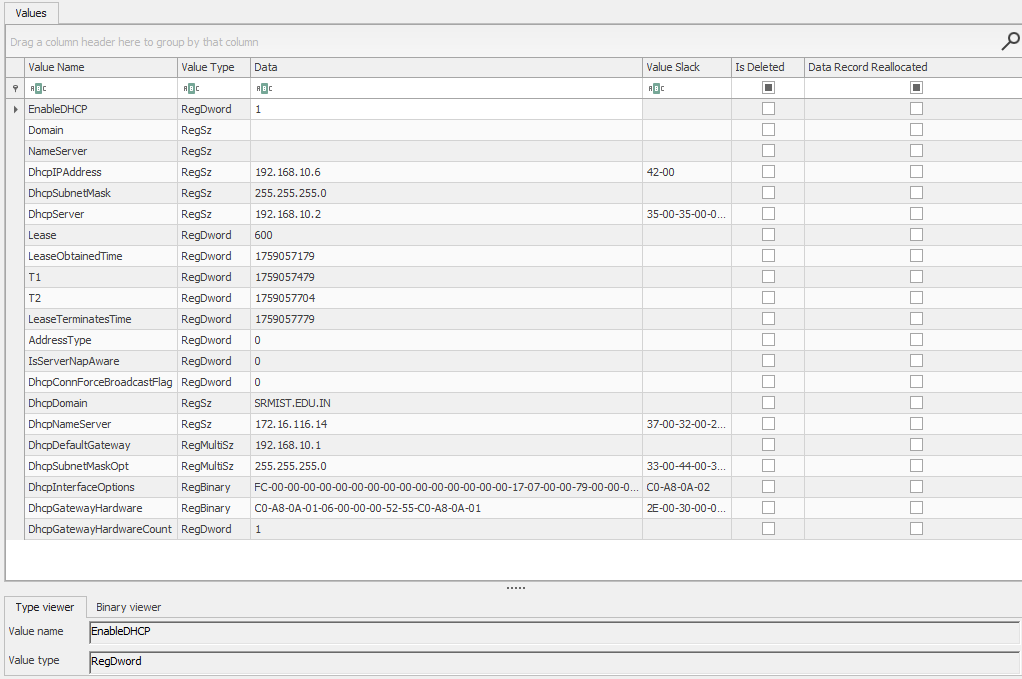
So that's how we can retrieve a user's network settings and information about network details.
Network configuration artifacts are crucial for understanding a system's connectivity and potential data exfiltration paths. The TCP/IP parameters store both static and DHCP-assigned network configurations. The NetworkList key maintains a history of wireless networks the system has connected to, which can be useful for geographic profiling or understanding movement patterns in mobile device forensics.
User Behavior Analysis
After finding the suspicious users/user then we have a look at their profile and see what they have done such as registry, running PowerShell, etc.
For the user behavior we gotta look at:
- UserAssist → Applications that are opened
- RecentDocs → files and folders opened
- Shellbags → locations browsed by the user
- Open / save MRU → files that were opened
- last visited MRU → applications used to open files
As we got only two users profiles, I take their NTUser hives to investigate because the jocosp user has no profile. Let's investigate Registry Paths for user behavior.
As we are having two users profiles we have to go through each and every one of them to see what activities were performed. To save time I won't be going through art-test account but server account as I did not conduct any activity on that account.
So let's begin the analysis.
Let's begin with shellbag - it tells us the files and folders that the user accessed. This is very important. Since we have already parsed the ntuser.dat files of both of the users using this script:
cmd(for %%H in (
"C:\Users\cryfo\artifact\F\Analysis\hives\SERVER-NTUSER.DAT"
"C:\Users\cryfo\artifact\F\Analysis\hives\Server-UsrClass.dat"
"C:\Users\cryfo\artifact\F\Analysis\hives\ART-TEST-NTUSER.DAT"
"C:\Users\cryfo\artifact\F\Analysis\hives\Art-Test-UsrClass.dat"
) do (
  echo ================================================================
  echo Processing %%~nxH
  echo ================================================================
  for %%P in (
  amcache fileassoc network runkeys userprofilelist winlogon
  userassist muicache recentdocs opensavemru open/savepid lastvisitedmru typedpaths typedurls explorer_runmrul mountpoints2 office runkeys internetsettings comdlg32 recentapps
  shellbags bagmru
  ) do (
    echo ---------- Plugin: %%P ----------
    rip.exe -r "%%H" -p %%P 2>&1
    echo.
  )
)) >> "C:\Users\cryfo\artifact\F\Analysis\hives\Parsed_Output.txt"
The shellbag provides a list of files that were opened as you can see in the image below:
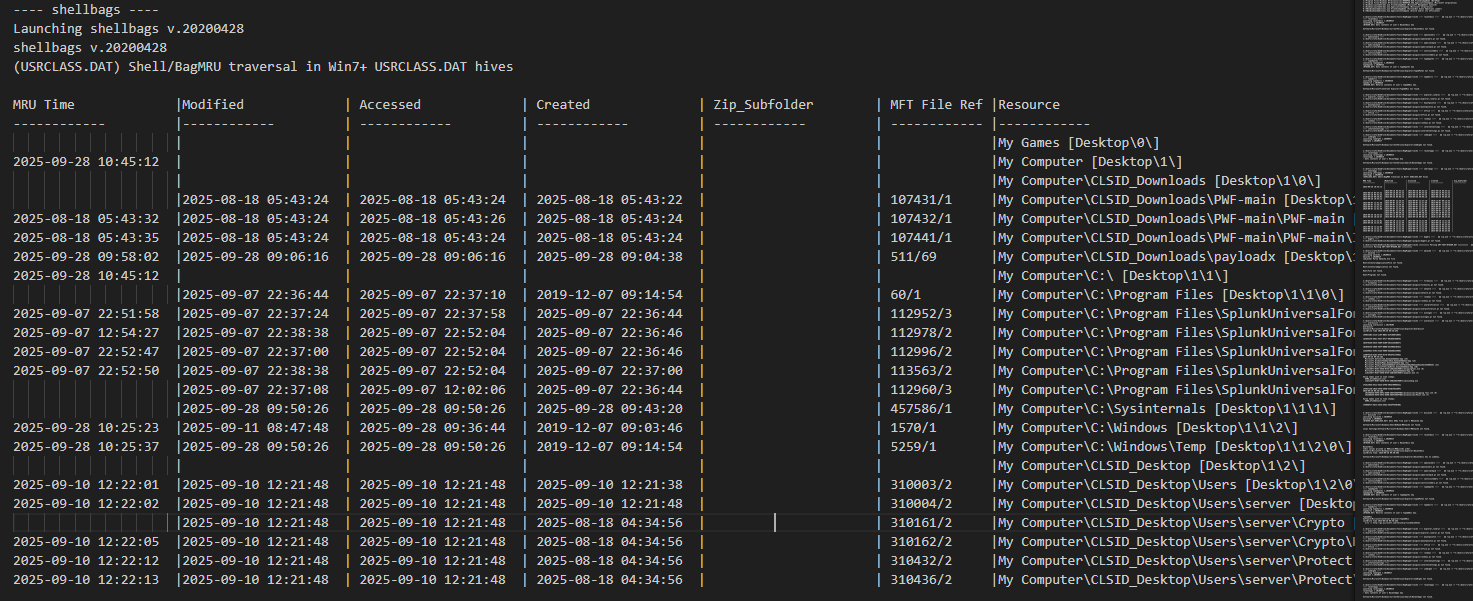
We can see the folders and files in tabular form along with their timestamp which is very important for forensic and correlating the events.
And we can also see the reference of MFT file as well, which we will look at later.
The next is RecentDocs - it shows us the lists of recently accessed documents — reveals what files a user opened.
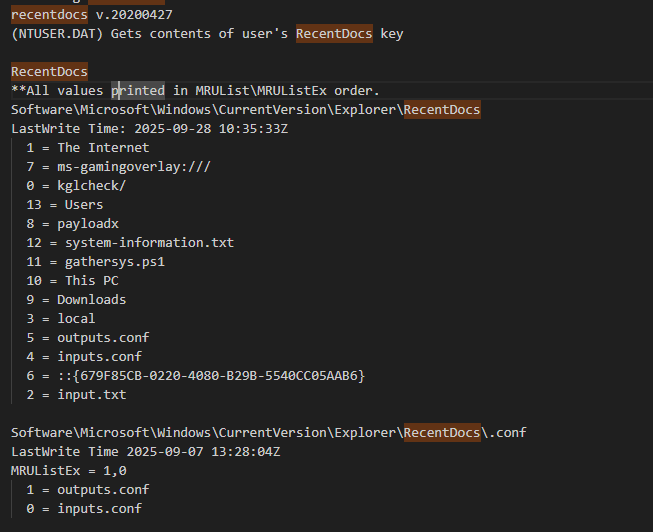
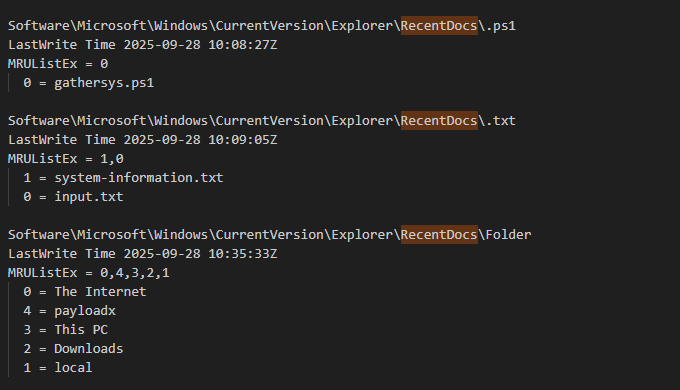
These are very important in forensics in case we are analyzing a machine compromised by malware - we can learn what files are opened by the malware. It's crucial and worthy checking.
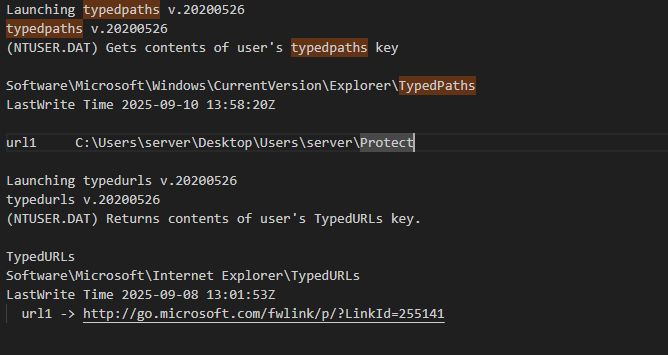
Moving to typedpaths - it logs manually typed folder paths in Explorer's address bar — direct navigation evidence.
While typedurls lists URLs manually typed in Internet Explorer — web browsing activity.
Both these are important during analysis - in case we can use it to see what URLs and folders the attacker manually typed.
It's important to check it out during forensic.
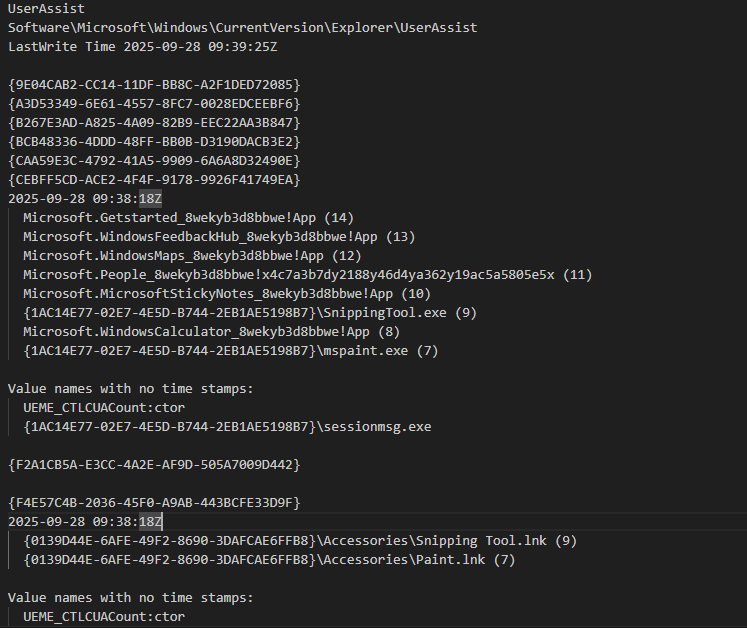
Moving to userassist - it records applications executed by the user through Explorer — provides user activity timeline.
I won't be going through all the hives. Now it's important to list out what matters and investigate it carefully to retrieve the information you want. And it's important also to adhere to the rules of forensic - correlate timestamps.
User behavior analysis through registry artifacts allows us to reconstruct a user's activities even without traditional log files. Shellbags maintain folder view settings (icon size, window position) but also create a record of accessed folders. UserAssist tracks GUI application execution through obfuscated ROT13 encoding. RecentDocs maintains lists of recently accessed files by extension. Together, these artifacts can paint a detailed picture of user activity, including program execution, document access, and browsing habits.
Evidence of Execution Analysis
To map out the evidence of execution there are some certain files we should look at:
- BAM
- Shimcache
- Amcache
- Prefetch
These are very important files to keep an eye on to find out the evidence of execution.
I will make a separate write-up for them but as for this one, we are writing up here.
Execution evidence artifacts are crucial for proving that specific programs ran on a system:
- BAM/DAM (Background Activity Moderator/Desktop Activity Moderator): Tracks background application usage, particularly on Windows 10+
- Shimcache (Application Compatibility Cache): Maintains a cache of file paths and their last modification times
- Amcache: Tracks application execution with detailed metadata including file hashes
- Prefetch: Contains preloading information for applications that improve startup performance but also provide detailed execution evidence
These artifacts often survive program uninstallation and even file deletion, making them invaluable for forensic investigations.
Key Findings Summary
Based on our comprehensive registry forensic analysis, here are the critical findings:
- Suspicious User Accounts: art-test and jocosp accounts with administrative privileges created outside normal procedures
- Malicious Persistence Mechanisms: Three suspicious scheduled tasks executing reconnaissance scripts and unauthorized applications
- Evidence of Reconnaissance: sysininfo.bat script gathering system information indicative of attacker reconnaissance
- User Activity Evidence: Shellbags, RecentDocs, and UserAssist artifacts providing user behavior timeline
- Network Configuration: Detailed network settings and connection history for investigation context
- USB Device History: Record of external storage devices connected to the system
- System Timeline: Installation dates, shutdown times, and user logon patterns for event correlation
This analysis demonstrates the wealth of evidence available in Windows Registry hives and the importance of thorough registry examination in digital forensic investigations.